- 0
- 타이쿤
- 조회 수 180
처음 시작 캔들 공부
글 제목
제1편. 음봉
제2편. 양봉
제3편. 돌파형
제1장. 하락 붕괴형
제2장, 상승 돌파형
제4편. 양봉 2 캔들 조합
제1장. Frog Hop - Bullish Two-Step Surge (Red Candle Style)
제2장.. Frog Squat - Bullish Stall Pattern (Red Candle Style)
제5편. 양봉 3캔들 조합
제1장. Ant Waist = Frog Squat + Frog Hop
제2장. Turtle neck=Frog Hop+Frog Squat
제6편. 에너지 고갈 패턴
제1장. NLB=No-Low Break Bear......음봉+상승 음봉
제2장. NHB=No-High Break Bull.....양봉+하락 양봉
제3장. High-Close Bear..................양봉+상승 음봉
제4장. Low-Close Bull....................음봉+하락 양봉
제7편. 에너지 과잉 패턴
제1장. Higher High Bear
제2장. Lower Low Bull
제8편. 체포 패턴
제1장. arrest bearish
제2장. arrest bullish
제9편. 역습 패턴 Counterattack Pattern
제1장. Push-Down High Bear
제2장. Lift-Up Low Bull
제10편. 상한가(H) 패턴
제1장. 1H
제2장. 2H
제3장. 3H
제4장. 4H
제11편. Trap after Breakout
제1장. Bull Trap after Breakout
제2장. Bear Trap after Breakout
제12편. Two-Day Bull Trap Gap Down
제1장. Frog Hop Gap down
제2장. Frog Squat Gap down
제13편. Deceptive candles
제1장. Blue candle with a higher close
제2장. Red candle with a lower close
제14편. Non-breakout candle
제1장. Non-breakout red candle
제2장. Non-breakout blue candle
제15편. Bluff and Reversal Candle
제1장. Bluff-Up Reversal candle
제2장, Bluff-Down Reversal candle
ㅡㅡㅡㅡㅡㅡㅡㅡㅡㅡㅡㅡㅡㅡㅡㅡㅡ
제1편. 음봉
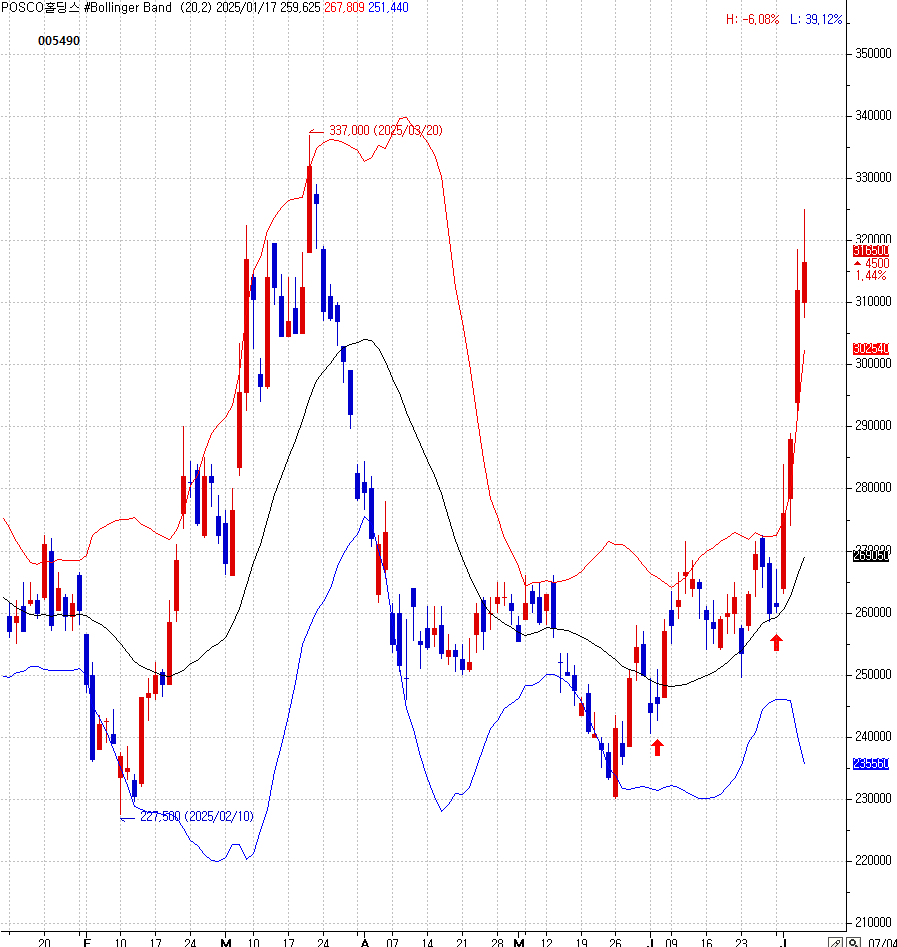
<POSCO홀딩스 005490 일간 차트>
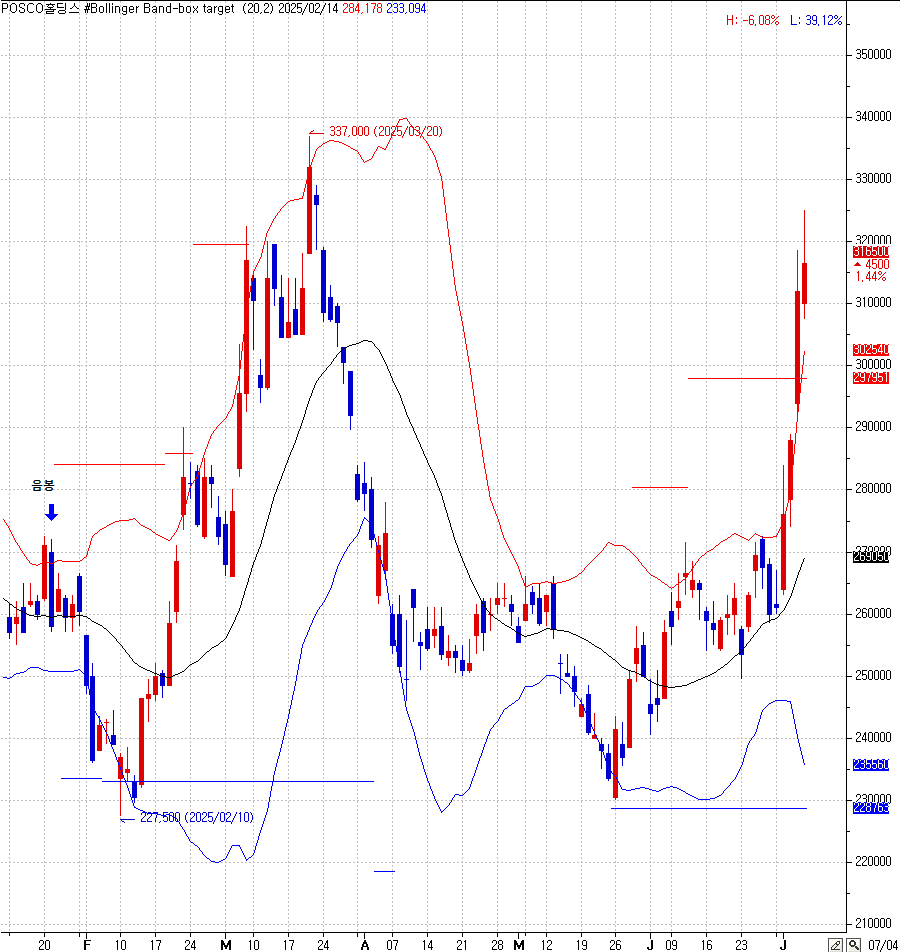
음봉이란 마치는 가격인 종가가 시작하는 가격인 시가보다 낮은 가격 패턴을 말하며 파랑색 캔들로 표시된다
박스권에서 볼린저 밴드 상단 밴드에 걸친 음봉은 매도 신호이다. 볼린저 밴드는 3개의 선으로 구성되면 상부선은 상단 밴드 중간선은 미들 밴드 하부선은 하단 밴드이다. 상단밴드는 미들 밴드에 2표준편차를 더한 것으로 박스권 상승 목표이고 하단밴드는 미들 밴드에 2 표준편차를 뺀 것으로 박스권 하락 목표이다. 박스가 붕괴되면 박스폭 만큼 상하 대칭 이동한다.
A bearish candlestick refers to a price pattern where the closing price is lower than the opening price, typically represented by a blue candle.
In a trading range (box pattern), a bearish candlestick touching the upper Bollinger Band is considered a sell signal. Bollinger Bands consist of three lines: the upper line is the upper band, the middle line is the middle band, and the lower line is the lower band. The upper band is calculated by adding two standard deviations to the middle band, serving as the upside target in a trading range, while the lower band is calculated by subtracting two standard deviations from the middle band, serving as the downside target in a trading range. If the box pattern breaks, the price tends to move symmetrically up or down by the width of the box.
제2편. 양봉
<POSCO홀딩스 005490 일간 차트>
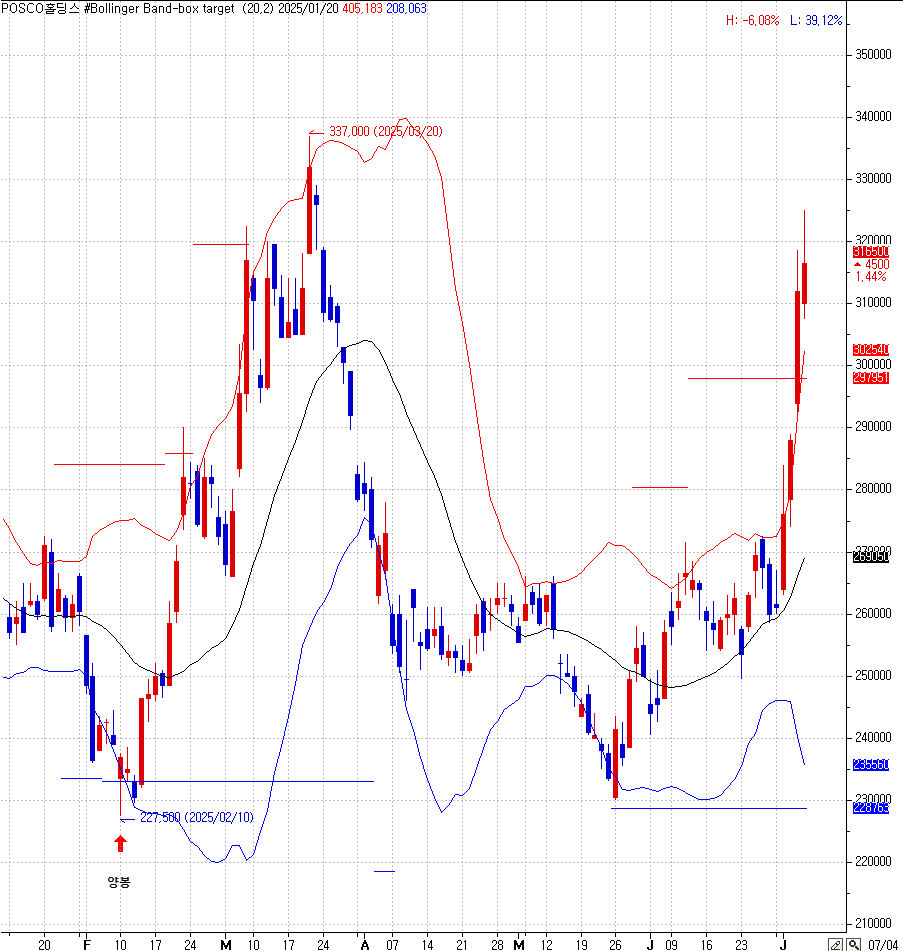
양봉이란 마치는 가격인 종가가 시작하는 가격인 시가보다 높은 가격 패턴을 말하며 빨강색 캔들로 표시된다
박스권에서 볼린저 밴드 하단 밴드에 걸친 양봉은 매수 신호이다. 볼린저 밴드는 3개의 선으로 구성되면 상부선은 상단 밴드 중간선은 미들 밴드 하부선은 하단 밴드이다. 상단 밴드는 미들 밴드에 2표준편차를 더한 것으로 박스권 상승 목표이고 하단 밴드는 미들 밴드에 2 표준편차를 뺀 것으로 박스권 하락 목표이다. 박스가 붕괴되면 박스폭 만큼 상하 대칭 이동한다. 박스가 붕괴되어 하락 대칭을 달성한 위치에서 양봉 형성은 매도 포지션을 청산하고 매수 포지션으로 바꾼것을 의미한다.
A bullish candlestick refers to a price pattern where the closing price is higher than the opening price, typically represented by a red candle.
In a trading range (box pattern), a bullish candlestick touching the lower Bollinger Band is considered a buy signal. Bollinger Bands consist of three lines: the upper line is the upper band, the middle line is the middle band, and the lower line is the lower band. The upper band is calculated by adding two standard deviations to the middle band, serving as the upside target in a trading range, while the lower band is calculated by subtracting two standard deviations from the middle band, serving as the downside target in a trading range. If the box pattern breaks, the price tends to move symmetrically up or down by the width of the box. When the box breaks downward and reaches the symmetrical downside target, the formation of a bullish candlestick indicates closing a short position and switching to a long (buy) position.
제3편. 돌파형 breakout pattern
제1장. 하락 붕괴형 downside breakout pattern...bearish breakdown pattern
<POSCO홀딩스 005490 일간 차트>

볼린저 상단 밴드에 걸친 음봉은 매도 신호이다. 특히 양봉 종가와 저가를 모두 붕괴키는 음봉은 볼린저 하단 밴드까지 하락과 박스권 붕괴 그리고 박스 대칭 하락도 빈번하게 나타난다.
A bearish candlestick touching the upper Bollinger Band is considered a sell signal. In particular, a bearish candlestick that breaks below both the closing price and the low of the previous bullish candlestick often leads to a decline toward the lower Bollinger Band, a breakdown of the trading range, and frequently a symmetrical downward move equivalent to the width of the box.
제2장. 상승 돌파형 bullish breakout pattern
<POSCO홀딩스 005490 일간 차트>
볼린저 박스 하단 밴드에 걸친 양봉과 볼린저 박스가 붕괴되어 대칭 하락이 나타난 바닥에서 하단 밴드에 걸친 양봉 특히 음봉 종가와 고가를 모두 돌파시키는 양봉은 볼린저 상단 밴드까지 상승과 박스권 돌파 그리고 박스 대칭 상승도 빈번하게 나타난다.
A bullish candlestick touching the lower Bollinger Band, especially one that breaks above both the closing price and the high of the previous bearish candlestick at the bottom of a symmetrical downward move following a Bollinger Band box breakdown, often leads to a rise toward the upper Bollinger Band, a breakout of the trading range, and frequently a symmetrical upward move equivalent to the width of the box.
제4편. 양봉 2 캔들 조합 bullish two-candle pattern
제1장. Frog Hop - Bullish Two-Step Surge (Red Candle Style) 개구리 점프 연속 양봉 패턴
<한화000880 일간 차트>
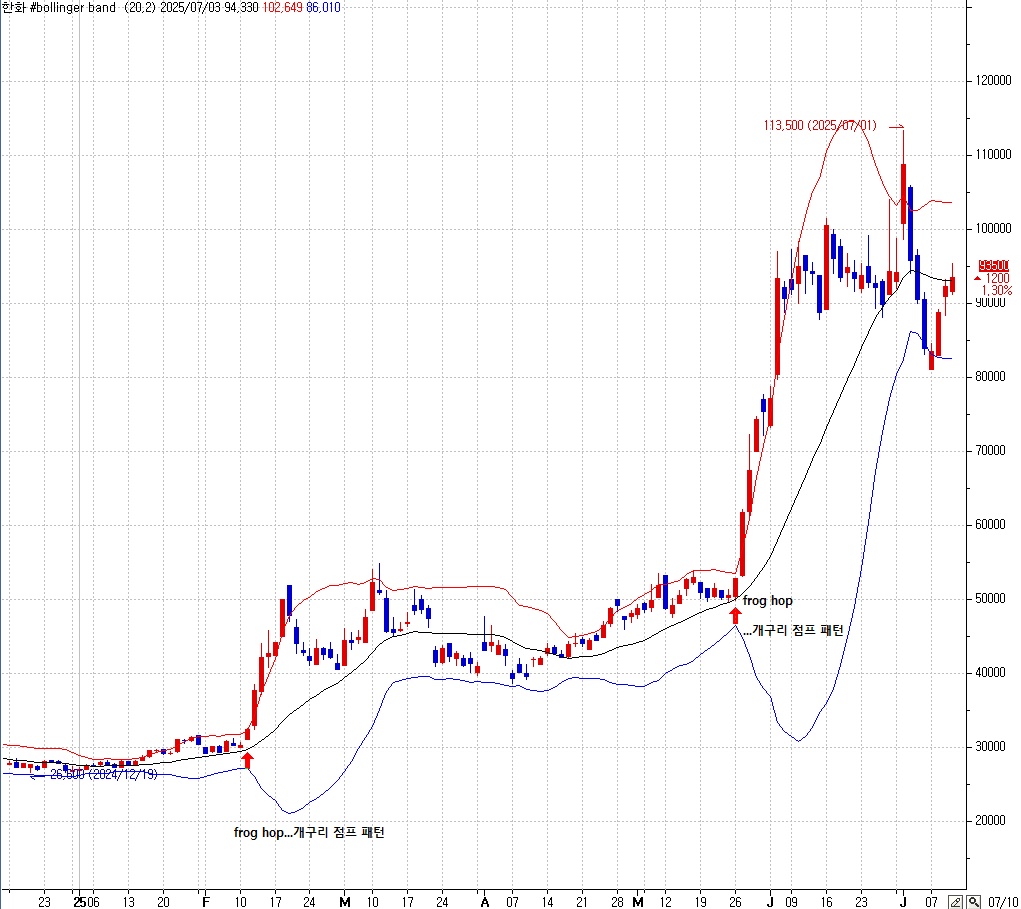
첫번째 양봉보다 두번째 양봉이 큰 패턴
🔎 네이밍의 시나리오화:
-
첫 양봉: 개구리가 몸을 움츠리는 준비 자세
-
두 번째 양봉: 개구리가 크게 점프
-
의미: 시장이 짧은 매수세로 준비한 후, 강하게 상승하는 초기 돌파 시그널
✅ "FROG HOP"이라는 명칭은 시각적, 심리적, 브랜딩 측면에서 매우 강력한 네이밍이다.
정형화된 정의 + 실전 예시를 함께 개발하면 널리 사용할 수 있는 독자적 개념이 될 수 있다.
작은 양봉 → 큰 양봉
= 상승 모멘텀이 강해지는 구조
Day 1: 작은 양봉 (개구리 준비 자세)
Day 2: 큰 양봉 (점프 시작)
→ 상승 초입, 추세 전환 포착 신호로 딱 맞음
🐸 Frog Hop – Bullish Two-Step Surge
-
첫 번째: 작은 양봉 → 준비 동작
-
두 번째: 큰 양봉 → 강한 매수세 폭발
-
상승 전환의 신호. 추세 시작 구간에서 자주 출현.
제2장.. Frog Squat - Bullish Stall Pattern (Red Candle Style) 개구리 쪼그림 - 강세 정체 패턴
<상지건설042940>2024/11/26
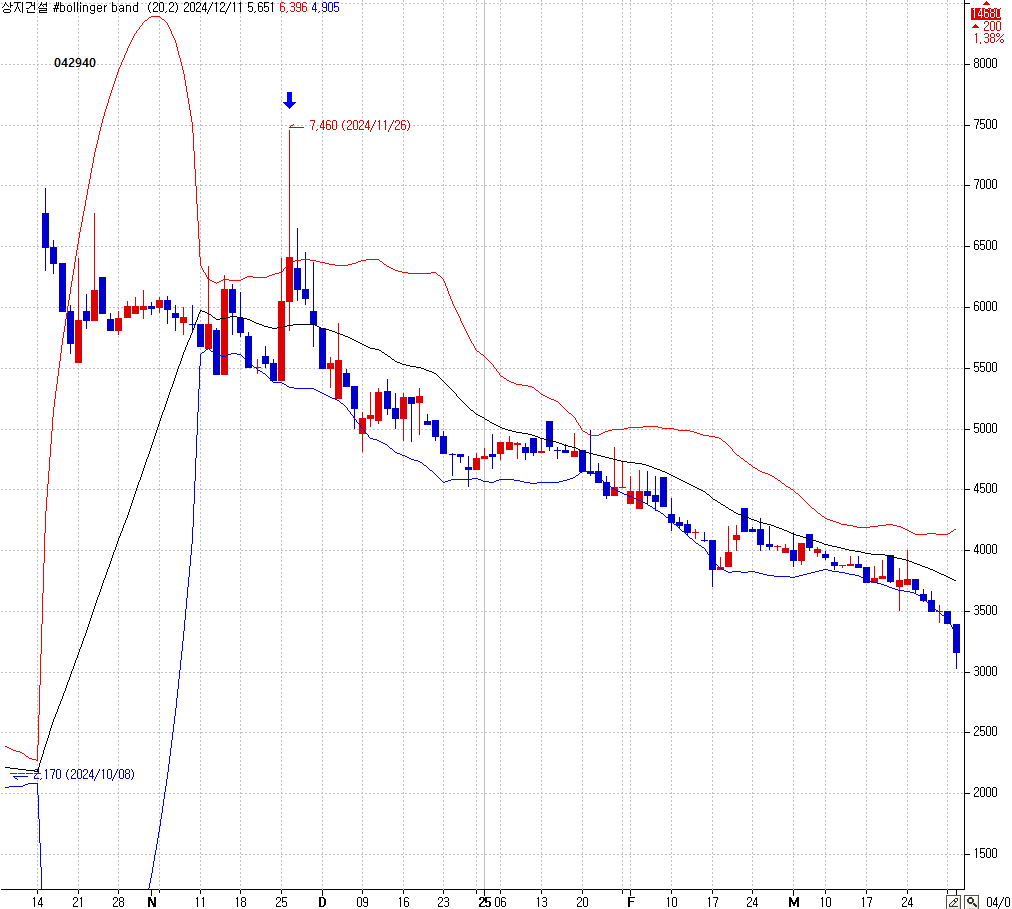
상승 축소 2양봉+볼린저 상단 밴드에 걸친 음봉
3395/7460=0.45......83일간 55% 하락
<KODEX200선물인버스2X>
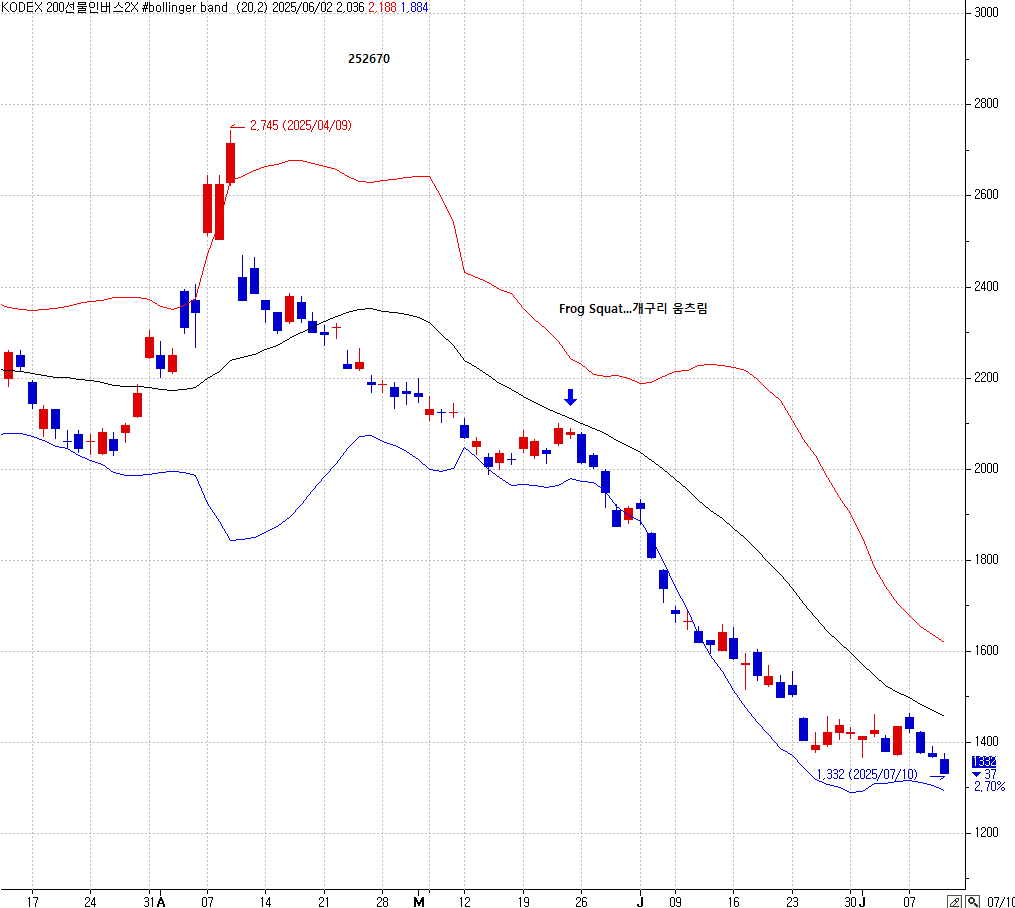
첫번째 양봉보다 두번째 양봉이 작은 패턴
하락 추세 반등 천정
-
“Hop”이 힘찬 도약이라면 “Squat”은 움츠림
-
상승은 했지만 강하지 않음
-
개구리가 도약하려다 주저앉는 그림
🐸 Frog Squat – Bullish Stall Pattern
큰 양봉 → 작은 양봉
= 상승 힘이 약해지고 망설이는 구조
-
첫 번째: 큰 양봉 → 초기 강세
-
두 번째: 작은 양봉 → 힘 빠진 매수세, 관망
-
⚠️ 상승세가 둔화되거나 피로감이 누적된 구조. 후속 봉 확인이 중요.
제5편. 양봉 3캔들 조합
제1장. Ant Waist = Frog Squat + Frog Hop 개미 허리 패턴...힘이 강함
"Ant Waist" 패턴 (3연속 양봉 구조화 버전)
"Ant Waist"는 단순히 3봉 양봉이 아닌, '허리-상체-하체' 구조를 상징하는 훌륭한 패턴 이름이다.
특히 마지막 양봉이 크다는 조건이 패턴을 더 강하게 만든다. 이건 트레이딩 신호로 정형화할 가치가 충분한 구조임.
🔍 패턴 해석:
-
매수세가 점진적으로 강화되며,
-
중간에 흔들림 없이 조용한 매집 구간이 있으며,
-
마지막에 강력한 돌파가 나오는 구조.
-
이건 단순한 3연속 양봉이 아니라,
**‘리듬감 있는 상승 구조’ + ‘심리적 에너지 축적 후 분출’**이라는 스토리를 가짐.
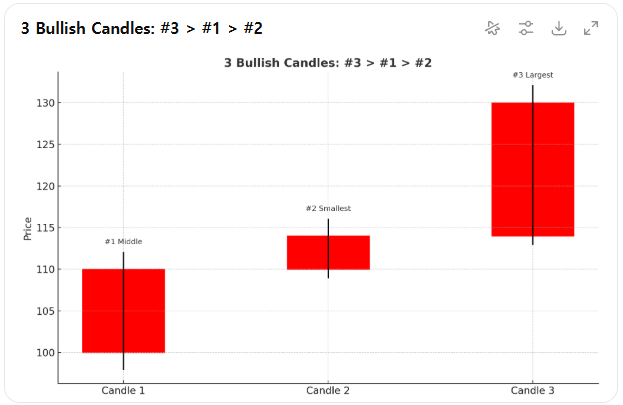
✅ 위 차트는 요청한 조건대로 구성된 3연속 양봉 패턴이다
-
2번째 양봉이 가장 작고
-
1번째 양봉이 중간 크기
-
3번째 양봉이 가장 크다
이런 구조는 잠깐의 망설임(2번째 양봉) 후에
**매수세가 급속도로 강화(3번째 양봉)**되는 패턴으로,
심리적으로는 “숨 고르기 후 전진” 구조라 볼 수 있다.
💬 네이밍 연결 효과
-
Frog Squat = 실패한 점프 (관망 신호)
-
Frog Hop = 성공한 점프 (진입 신호)
-
Ant Waist = “도약 실패처럼 보였지만, 결국 성공한 구조”
→ 즉, 위장된 하락 or 속임수 눌림 구간 + 매수세 회복
Ant Waist는 '도약하려다 주춤했다가 결국 뛰는' 3단 상승 구조를 의미한다.
제2장. Turtle neck=Frog Hop+Frog Squat 거북 목 패턴
The Turtle Pattern is a custom candlestick formation where a bearish candle is followed by three bullish ones — the second candle surges the most, like a turtle stretching its head before cautiously pulling back.”
-
Turtle Neck Candle Formation
-
Cautious Turtle Breakout
-
Stretch-and-Retract Turtle Pattern
Three White Soldiers with a Mid Peak.
Three Rising Candles with a Second Candle Peak.
거북이 패턴은 하나의 음봉 뒤에 세 개의 양봉이 연속해서 나타나는 맞춤형 캔들 패턴이다. 이 중 두 번째 양봉이 가장 크게 상승하고 세번째 양봉이 상승 축소되는 패턴인데, 이는 마치 거북이가 머리를 쭉 내밀었다가 조심스럽게 다시 움츠리는 모습과 유사하다
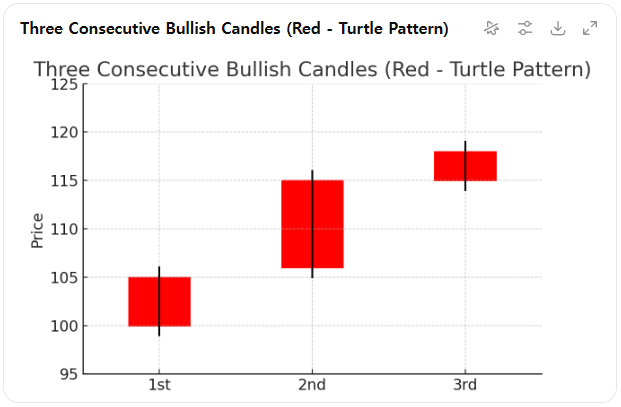
이 차트는 “거북이 패턴(Turtle Pattern)”을 직관적으로 보여주는 예시로,
두 번째 캔들이 가장 크고, 세 번째 캔들이 줄어드는 구조를 강조하고 있다.
This chart visually illustrates the so-called "Turtle Pattern", where three consecutive bullish candles appear — with the second candle being the largest and the third candle showing a noticeable reduction in size.
The pattern resembles a turtle stretching its head out (second candle), then pulling it slightly back (third candle), signaling potential momentum exhaustion or hesitation in the upward trend.
A classic "Turtle Pattern":
🟥 Three bullish candles in a row
🔺 The second one is the tallest
🔻 The third candle shrinks — just like a turtle pulling its head back after peeking out
이 차트는 일명 **‘거북이 패턴(Turtle Pattern)’**이라 불리는 형성을 시각적으로 보여준다.
이 패턴에서는 양봉이 세 개 연속으로 나타나며, 두 번째 양봉이 가장 크고, 세 번째 양봉은 눈에 띄게 작아지는 특징이 있다.
이 흐름은 거북이가 머리를 길게 내밀었다가(두 번째 캔들), 다시 살짝 움츠리는(세 번째 캔들) 모습과 유사하다.
이는 상승 모멘텀의 소진 혹은 추세에 대한 망설임을 시사할 수 있다.
<S&P500 선물 일간 차트>
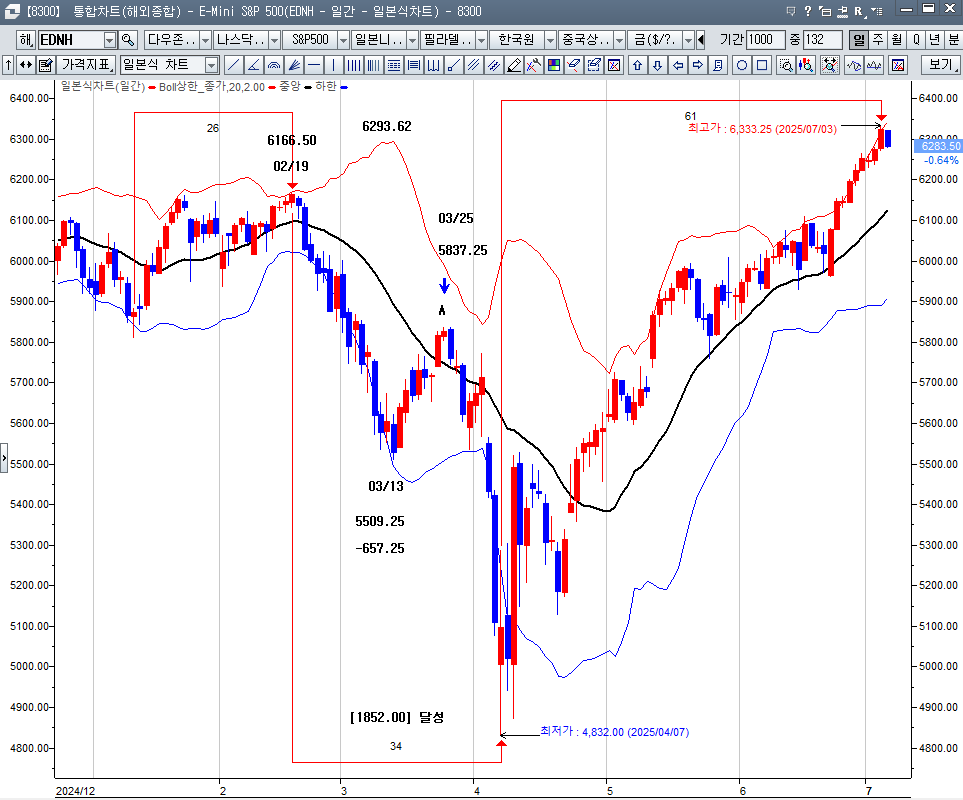
볼린저 미들 밴드가 하락하는 하락 추세에서 미들 밴드를 돌파한 후에 3번째 양봉에서 매수세가 현저하게 위축되는 모습.
이후 매수세가 실종되며 대칭 하락으로 급락하는 패턴이 형성된다.,
✅ 패턴 구조 정리
-
1번째 캔들: 음봉 (Bearish candle)
-
2~4번째 캔들: 양봉 3개 연속
-
2번째(1번째 양봉): 작음
-
3번째(2번째 양봉): 2번째보다 큼
-
4번째(3번째 양봉): 3번째보다 작음
-
✅ 영어 표현 제안
| 유형 | 제안 표현 | 설명 |
|---|---|---|
| 📘 전통적 캔들 분석식 | Three White Soldiers with a Mid Peak | 일반적인 3연속 양봉 패턴(Three White Soldiers)에서 두 번째 캔들이 가장 크고 세 번째는 작아진 구조 |
| 📘 직관적 기술적 용어 | Three Rising Candles with a Second Candle Peak | "두 번째 양봉이 최고점인 3연속 상승 캔들"이라는 설명적 표현 |
| 📈 실전 트레이딩 스타일 | Three Candle Surge with Fading Momentum | 두 번째 양봉에서 피크를 찍고 세 번째는 힘이 빠진다는 느낌 (모멘텀 약화) |
| 🧠 분석적 해석형 | Bullish Climb with Mid-Run Exhaustion | 상승 중간 구간에서 피로감(exhaustion)이 나타나는 구조라는 뜻 |
| 📊 차트 분석 용어 | Rising Trio with Decelerating Finish | 상승 3연봉 중 끝날수록 감속하는 흐름 강조 |
✅ 실전 사용 예
“The pattern resembles a Three White Soldiers with a peak on the second candle, indicating a strong bullish push followed by slight exhaustion.”
“This three rising candle pattern with a mid-candle climax may imply buyers are losing momentum.”
👉 “이 패턴은 두 번째 양봉이 최고점인 '세 개의 흰 군인(Three White Soldiers)' 패턴을 닮았으며, 강한 상승 흐름 뒤에 약간의 피로감이 뒤따르는 모습을 나타낸다.”
👉 “중간 봉이 정점을 찍는 이 세 개의 상승 캔들 패턴은 매수세의 모멘텀이 약해지고 있음을 시사할 수 있다.”
Mid Peak는 주식 차트나 기술적 분석에서 사용되는 용어로, 가격이 상승 추세 중에 일시적으로 도달한 중간 고점을 의미합니다. 이는 상승장이 계속되다가 잠시 멈추거나 조정을 받기 전에 형성되는 가격의 정점을 가리킵니다.
- 특징:
- 상승 추세에서 가격이 일시적으로 최고점에 도달하지만, 전체 추세의 최종 고점(final peak)이 아니라 중간 단계의 고점입니다.
- 이후 가격은 하락(조정)하거나 횡보(보합) 상태로 전환될 수 있습니다.
- 기술적 분석에서 Mid Peak는 저항선이나 중요한 피보나치 되돌림 수준과 연관될 수 있습니다.
예를 들어, "Three White Soldiers" 패턴 후에 Mid Peak가 나타난다면, 강한 상승세가 잠시 멈추고 조정이 올 가능성을 시사할 수 있습니다. 이 용어는 주로 차트 패턴 분석에서 맥락에 따라 해석됩니다.
<HD한국 조선 해양 일간 차트>
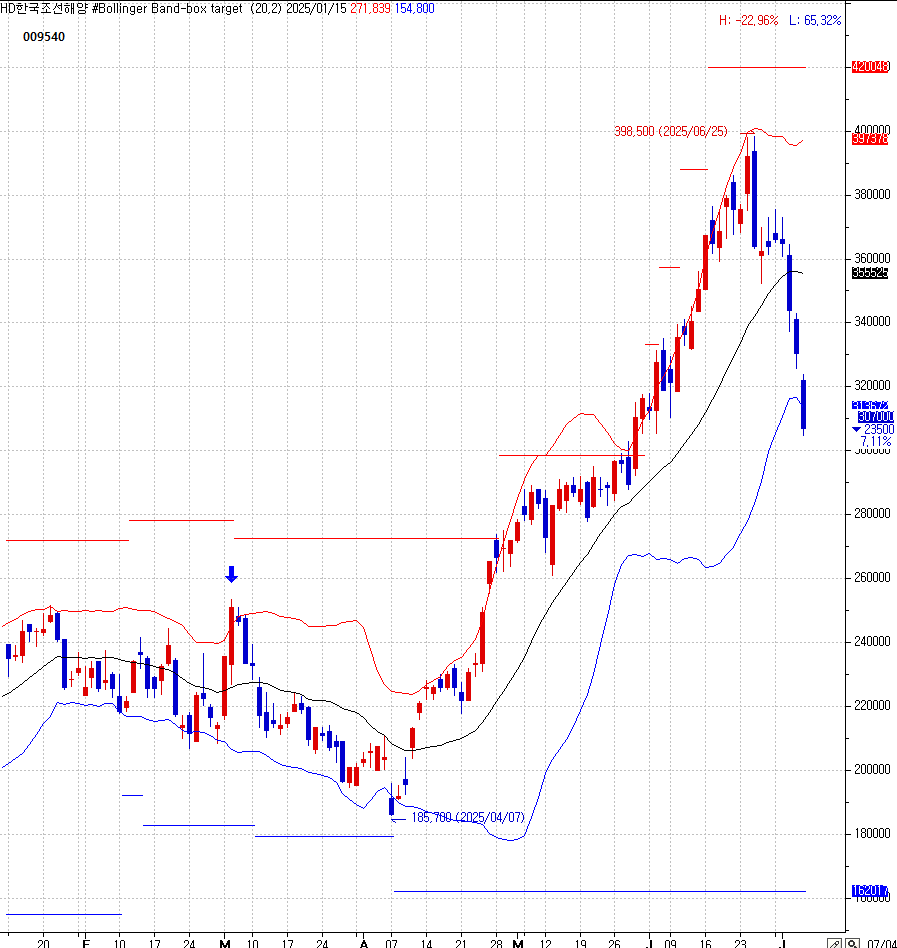
3번째 양봉이 2번째 양봉에 비해 상승세가 축소되며 볼린저 하단 밴드를 붕괴시키는 급격한 하락이 나타나는 모습이다.
✅ 활용 예시:
-
“We’re seeing a Turtle Pattern forming on the daily chart — a classic sign of hesitation after a strong intraday push.”
-
“The second candle is the turtle’s neck fully stretched. The third candle shows it pulling back slightly, signaling loss of momentum.”
-
👉 “일봉 차트에서 ‘거북이 패턴’이 형성되고 있다 — 이는 강한 장중 상승 이후 나타나는 전형적인 망설임의 신호다.”
👉 “두 번째 캔들은 거북이 목이 완전히 뻗은 모습이다. 세 번째 캔들은 그것이 살짝 움츠러드는 모습을 보여주며, 모멘텀 상실을 시사한다.”
제6편. 에너지 고갈 패턴
제1장. NLB=No-Low Break Bearr......음봉+상승 음봉...
The No-Low Break Bear shows sellers are active, but lack the strength to break support.
매도세는 있지만, 지지선을 무너뜨릴 만큼 강하진 않다는 신호다.
# POSCO 홀딩스 일간 차트
종가 하락 음봉
종가 상승 음봉......매도세 약화
볼린저 미들 밴드 지지
볼린저 미들 밴드 상방
큰 양봉으로 3개의 연속 음봉을 돌파
연속 4개의 양봉
1음+3음=4양......최근 매도세 전부 매수세로 전환
# 삼성전자 일간 차트
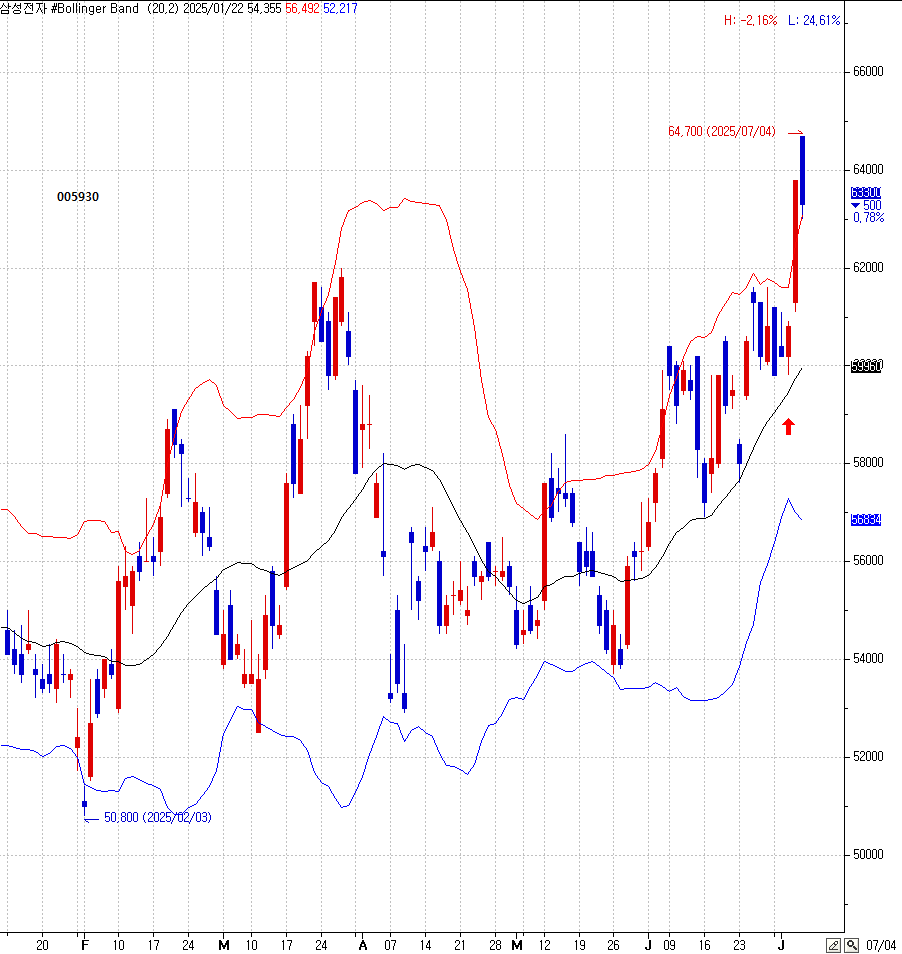
종가 하락 음봉
종가 상승 음봉......매도세 약화
볼린저 미들 밴드 지지
볼린저 미들 밴드 상방
2개 연속 양봉으로 2개 연속 음봉을 돌파
연속 2개 음봉 매도세가 모두 매수세로 전환
# HD한국조선해양 일간 차트
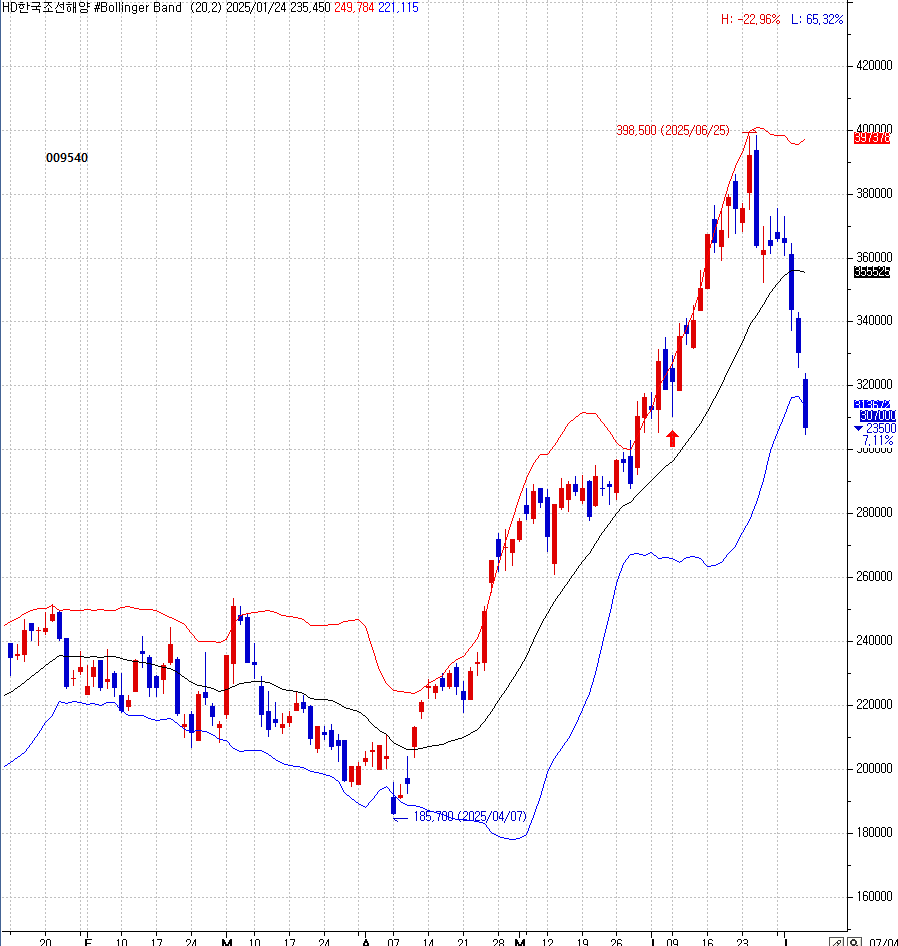
종가 하락 음봉
종가 상승 음봉......매도세 약화
볼린저 미들 밴드 지지
볼린저 미들 밴드 상방
큰 양봉으로 2개의 연속 음봉을 돌파
4번의 연속 양봉 흐름 생성
1양+3양=2양+2양......매수세 결합
# 카카오페이 일간 차트
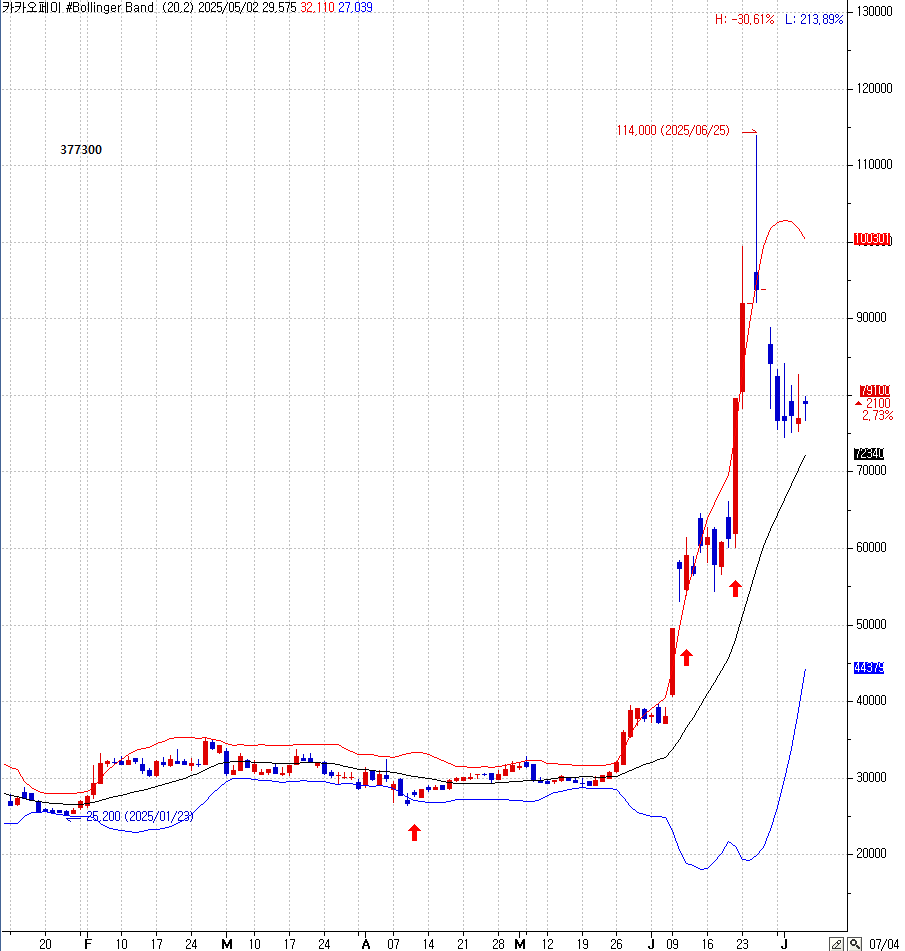
상단 밴드 돌파하는 상한가
상한가 익일 음봉이나 가격은 상승
전일 상한가 매수한 사람들이 상한가 익일 익절
시가보다 높은 가격에 매도한 사람들이 매도 가격보다 낮은 가격에 재매수
#한국 정보 통신 025770 일간 차트
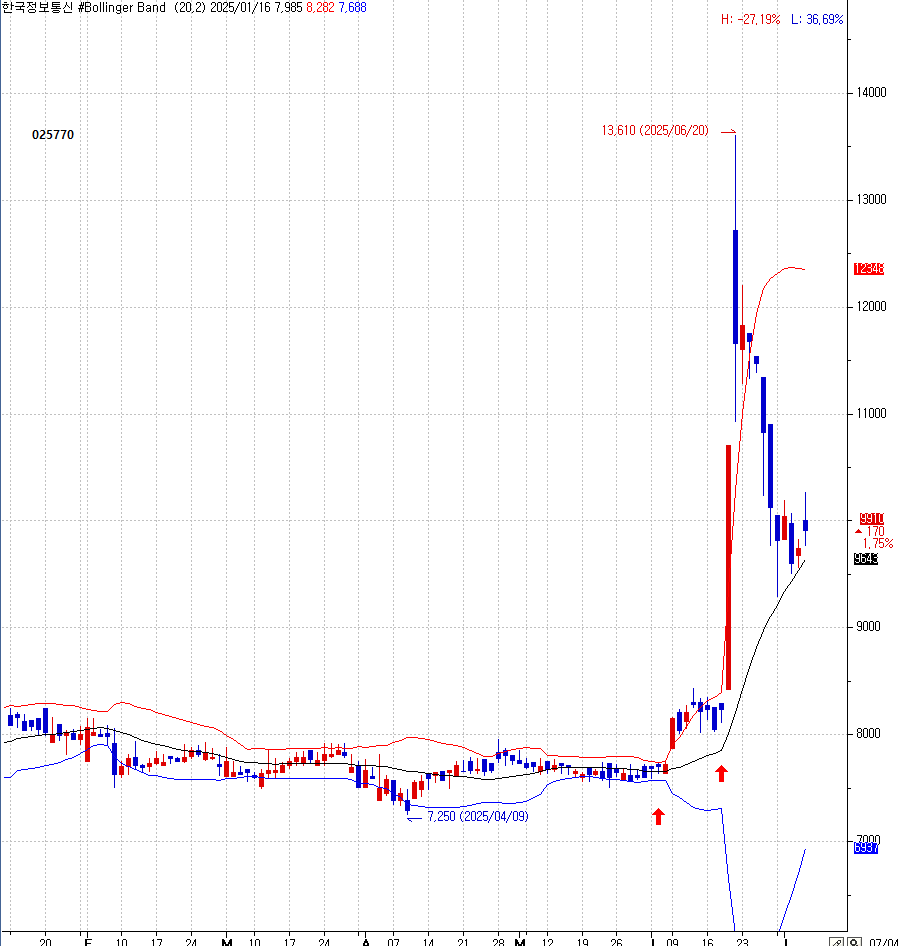
종가 하락 음봉
종가 상승 음봉......매도세 약화
볼린저 미들 밴드 지지
볼린저 미들 밴드 상방
큰 양봉으로 5개의 연속 음봉을 돌파
상한가 익일 시가보다 높은 가격에 익절
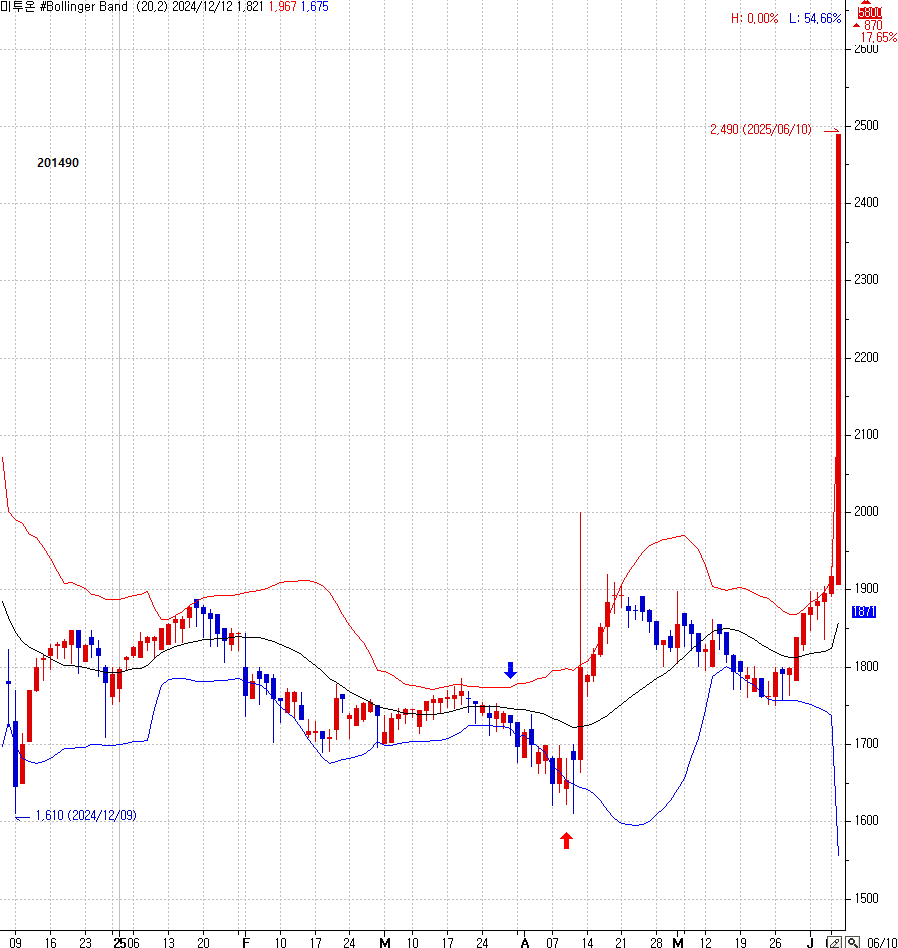
#미투온 201490 일간차트
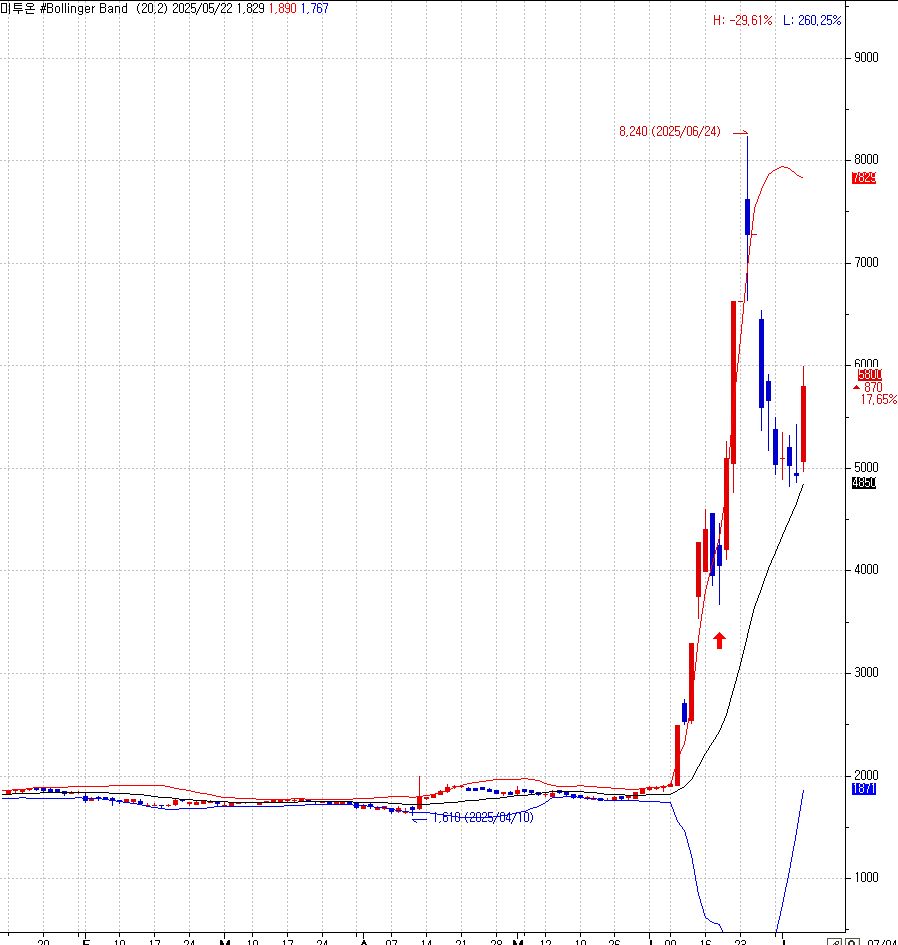
2번째 음봉 저가가 1번째 음봉 저가 붕괴이나
2번째 음봉 종가가 1번째 종가 지지 상태이다.
종가 하락 음봉
종가 상승 음봉......매도세 약화
볼린저 미들 밴드 지지
볼린저 미들 밴드 상방
큰 양봉으로 2개의 연속 음봉을 돌파
돌파 양봉 익일 상한가
상한가 이후 시가보다 높은 가격에 익절
<다날 064260 일간 차트>
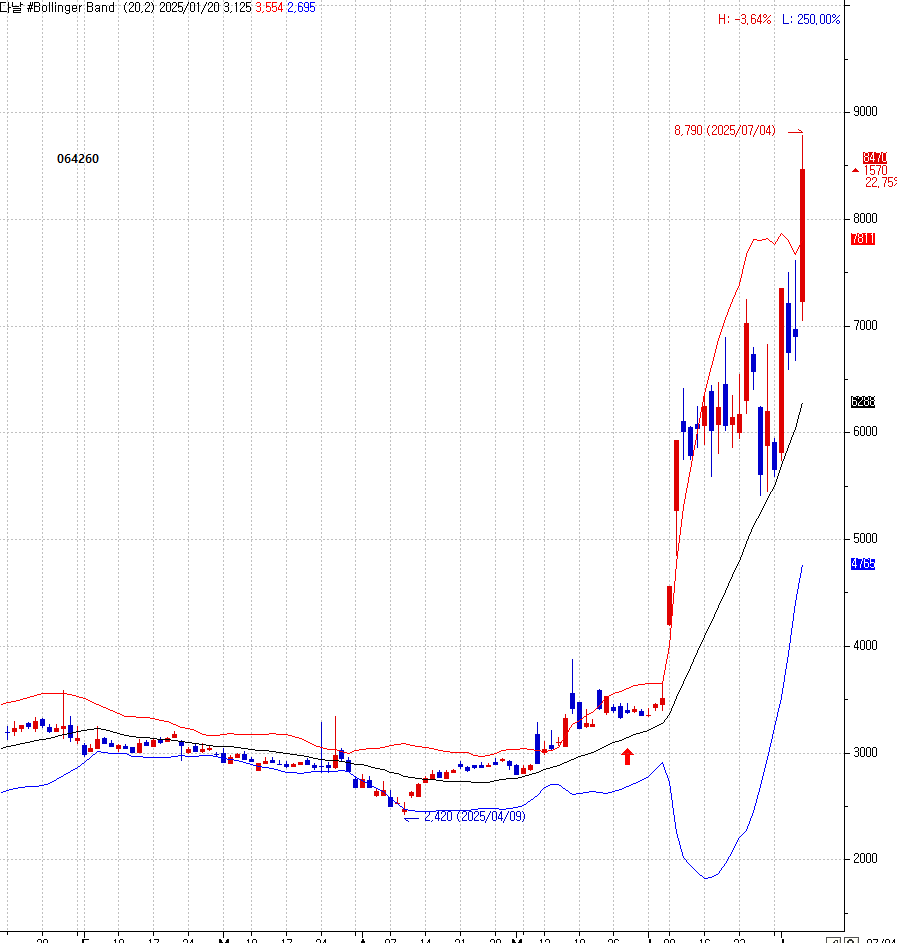
종가 하락 음봉
종가 상승 음봉......매도세 약화
음봉
양봉
볼린저 미들 밴드 지지
볼린저 미들 밴드 상방
연속 3개의 연속 양봉
연속 2개의 상한가
연속 5개의 양봉 익일 시가보다 높은 가격에 익절
제2장. NHB=No-High Break Bull......양봉+하락 양봉
The No-High Break Bull shows buyers are present, but not yet strong enough to break above resistance.
매수세가 존재하지만, 저항선을 돌파할 만큼 강하진 않다는 것을 보여준다.
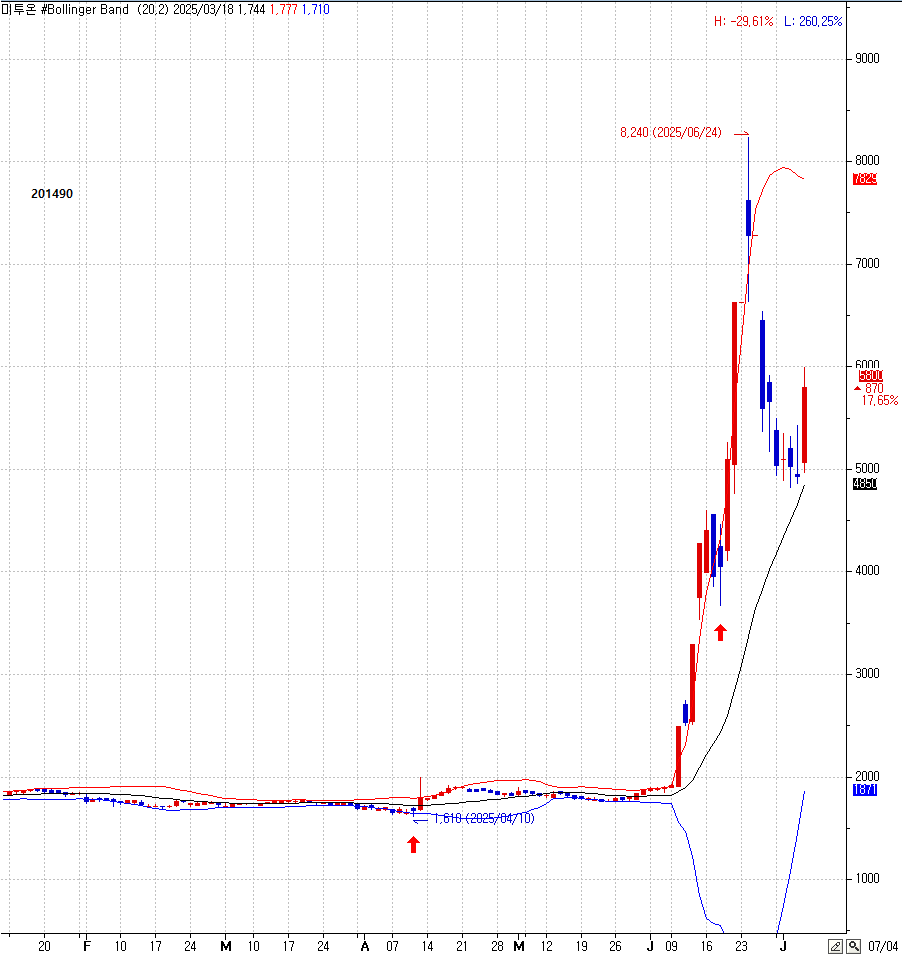
<미투온 201490 일간 차트>
종가 상승 양봉+종가 하락 양봉...익일 종가 하락 음봉
4번의 하락 흐름 형성
2음
1음
1음
1음
종가 상승
종가 상승 양봉+종가 하락 양봉...익일 종가 상승 음봉...익일 큰 양봉으로 최근 매도세 전부 돌파
<다날 064260 일간 차트>
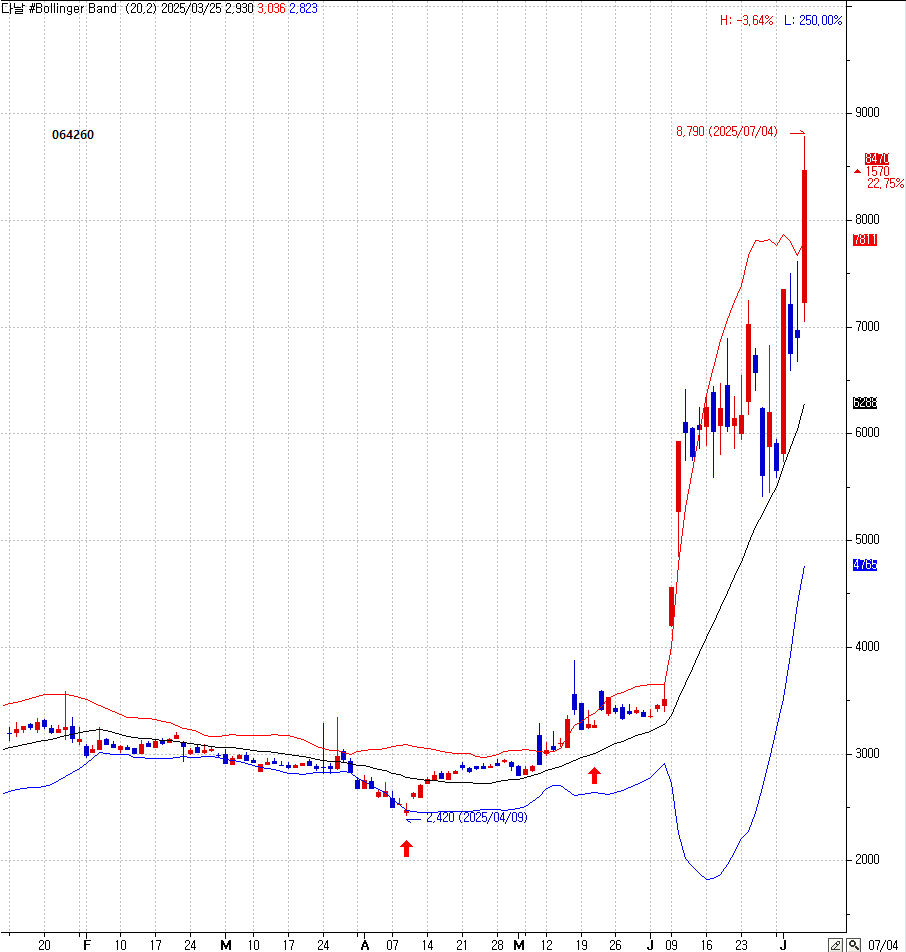
종가 상승 양봉+종가 하락 양봉...익일 종가 상승 음봉
1음,3음,1음......3번의 하락 흐름
1음,3음,1음......연속 5개의 양봉 급등
최근 매도세가 모두 매수세로 전환
제3장. High-Close Bear......양봉+상승 음봉
The High-Close Bear is a bearish candle, but the selling pressure is weak enough that the close remains above the previous day's close.
#미투온 201490 일간차트
High-Close Bear 는 음봉이지만, 매도세가 약해 전일 종가보다 높은 위치에서 마감한 상태이다.
→ 이는 매도세가 있긴 하나 아직 주도권을 완전히 잡지 못한 약한 매 신호로 해석할 수 있다.
제4장 Low-Close Bull....음봉+하락 양봉
<미투온201490 일간 차트> 상승형
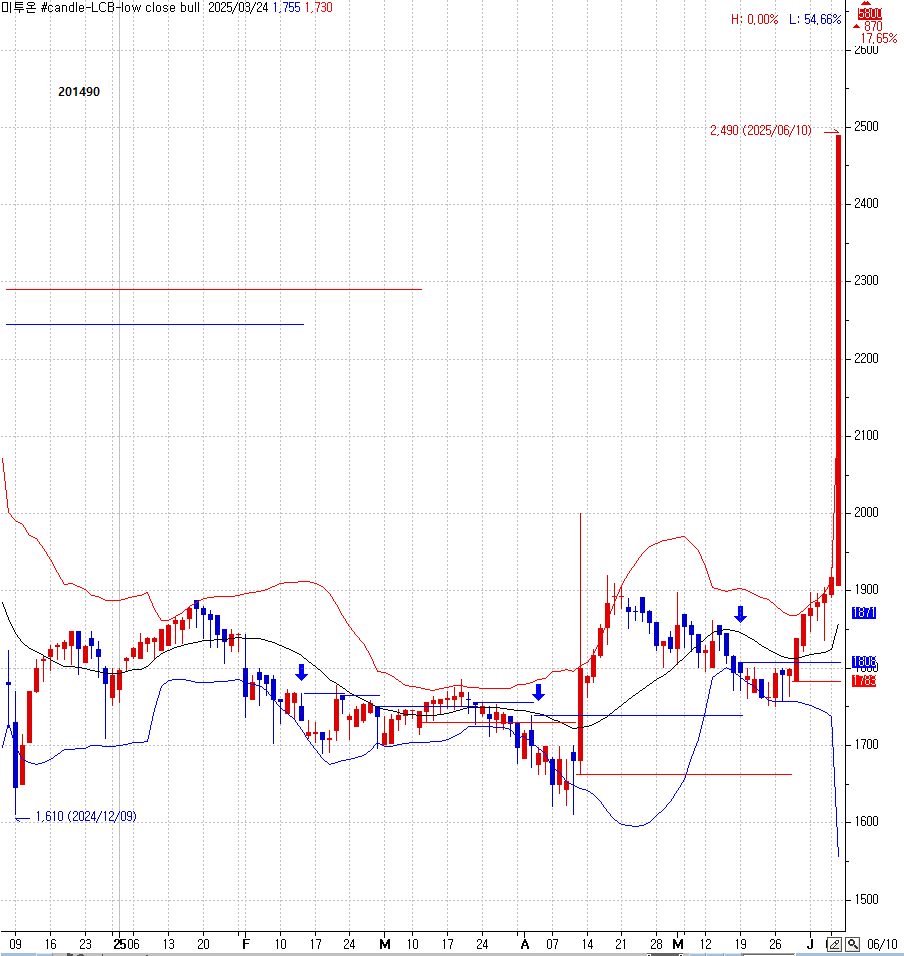
The Low-Close Bull is a bullish candle, but the close is lower than the previous day's close, indicating that buyers were present but failed to overpower the selling pressure.
The Low-Close Bull은 양봉이긴 하지만 종가가 전일 종가보다 낮게 마감된다는 점에서, 매수세가 존재했지만 매도 압력을 완전히 이겨내지 못했음을 나타낸다.
2번의 하락 흐름 후 급등 전환
<미투온201490 일간 차트> 하락형
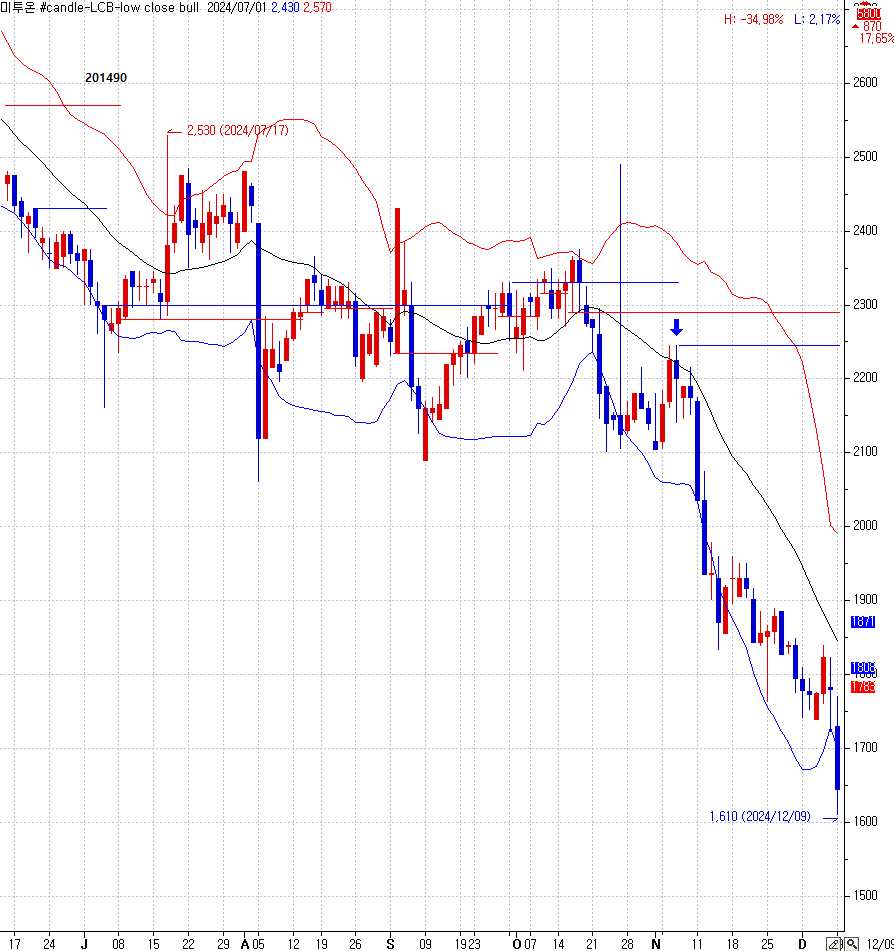
Low-Close Bull은 양봉이지만 전일 종가보다 낮아, 매수세가 존재하긴 해도 매도세를 완전히 이기지 못한 상태다.
제7편. 에너지 과잉 패턴
제1장. HHB((Higher High Bear)
<두산000150 일간 차트>
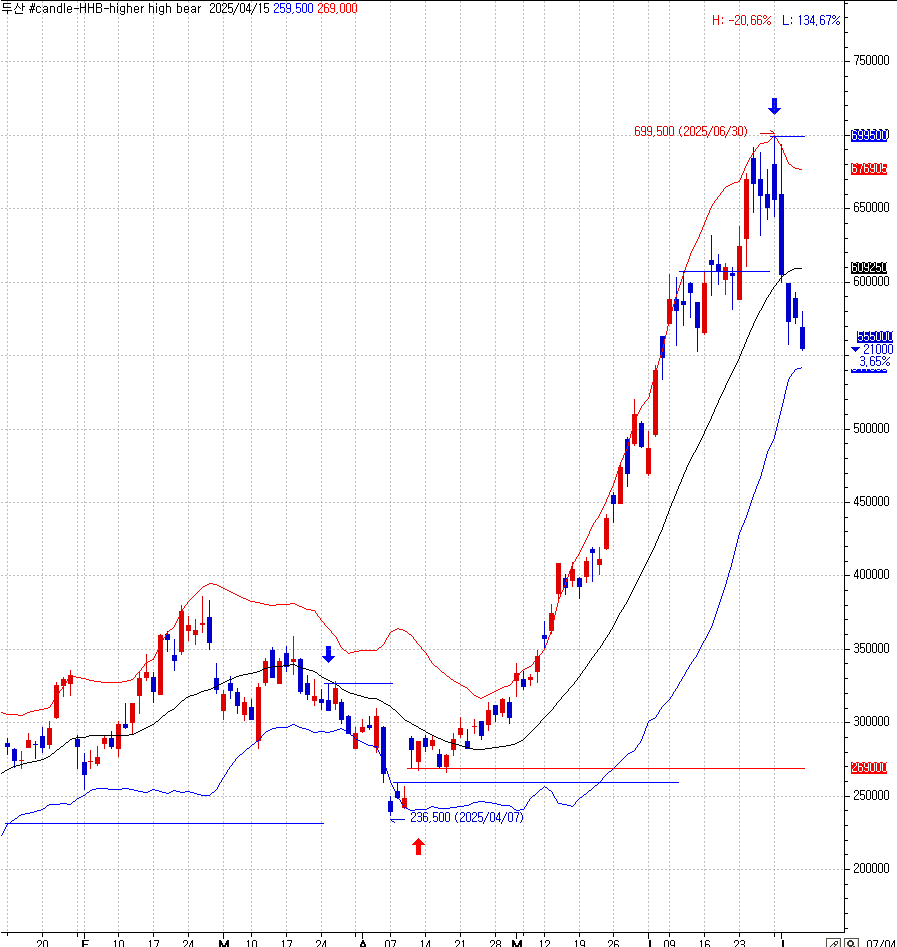
Higher High Bear is a bearish candlestick pattern in which the current candle's high price exceeds the previous candle's high, but the candle still closes lower than it opens—resulting in a red (bearish) candle.
It reflects an initial attempt by buyers to push the price higher, but sellers eventually take control and drive the price down by the close.
Higher High Bear는 음봉이면서 고가가 전일 고가보다 더 높은 형태의 캔들 패턴이다.
처음에는 매수세가 강하게 들어와 전일 고가를 돌파하지만, 장 후반에는 매도세가 우세해져 종가가 시가보다 낮아 음봉으로 마감된다.
제2장. Lower Low Bull
<포스코엠텍 009520>2022.10.11 일간 차트
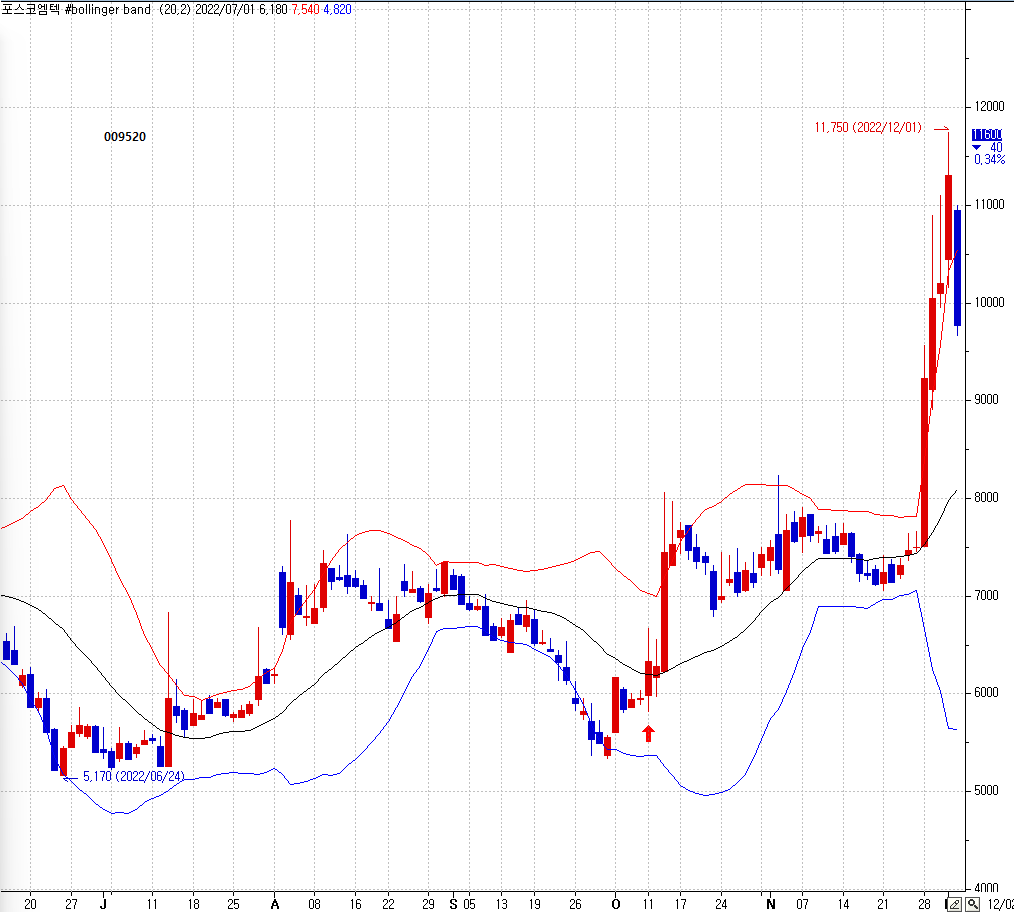
금일 저가가 전일 저가보다 낮지만 종가는 상승하는 양봉
Lower Low Bull is a bullish candlestick pattern in which the current candle’s low dips below the previous candle’s low, but it still closes higher than it opens—resulting in a green (bullish) candle.
This indicates that sellers initially drove the price down, making a new low, but buyers stepped in strongly and pushed the price higher by the close.
Lower Low Bull는 저가가 전일 저가보다 더 낮지만 양봉으로 마감되는 강세 캔들 패턴이다.
처음에는 매도세가 강하게 작용해 전일 저가를 갱신하지만, 이후 매수세가 유입되어 종가가 시가보다 높아 양봉으로 마감된다.
제8편. 체포 패턴
제1장. arrest bearish
<에코프로086520> 일간 차트
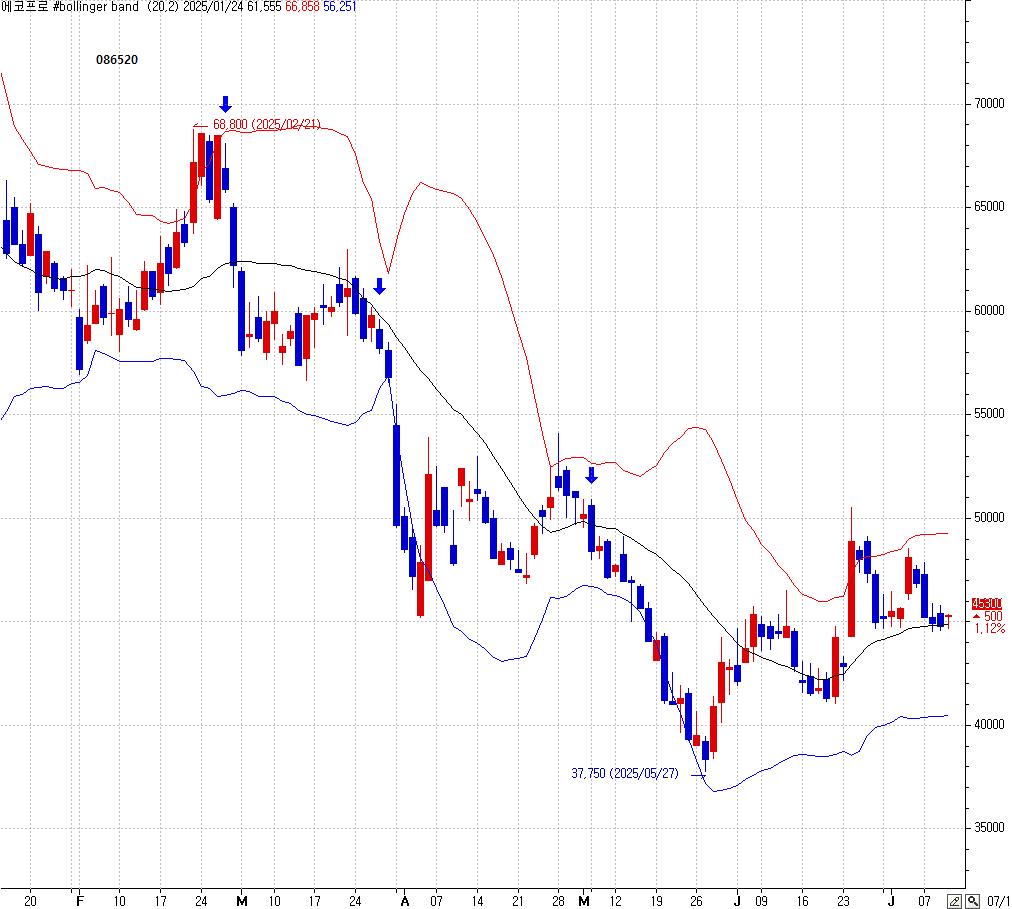
음봉+양봉+음봉......2개의 좌우 음봉이 1양봉을 체포해서 끌고 내려가는 패턴
Arrest Bearish Pattern is a candlestick formation composed of a bearish candle, a bullish candle, and another bearish candle. The bullish candle is "arrested" as it gets trapped between two bearish candles. If a third bearish candle breaks below the low of the second candle, it signals the formation of a downtrend.
Arrest Bearish 패턴은 음봉+양봉+음봉 캔들 조합이며 양봉이 두 음봉 사이에 갇히며 '체포'당하는 구조다. 두번째 음봉 저가가 붕괴되는 음봉이 나타나면 하락 추세가 형성된 신호다
제2장. arrest bullish
<한화000880> 일간 차트
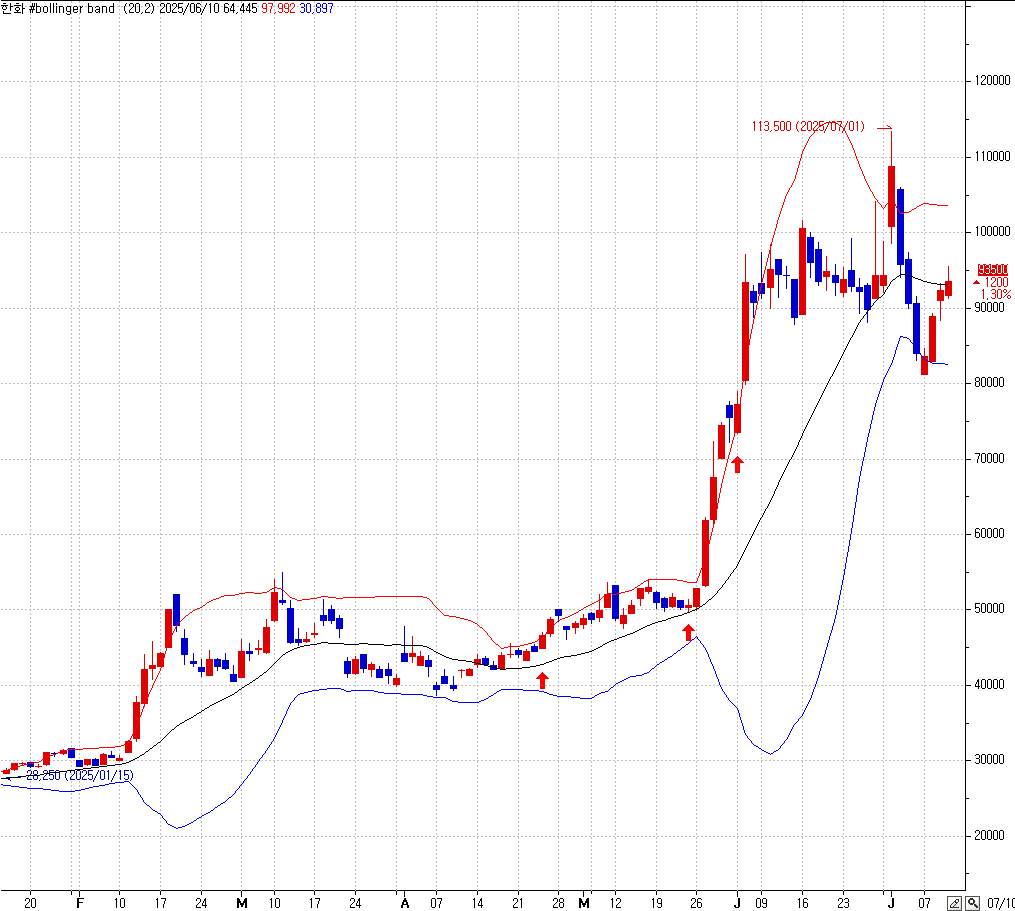
2개의 좌우 양봉이 가운데 음봉 1개를 체포해서 위로 끌고 가는 패턴
Arrest Bullish Pattern is a candlestick formation composed of a bullish candle, a bearish candle, and another bullish candle. The bearish candle is "arrested" as it gets trapped between two bullish candles. If a third bullish candle breaks above the high of the second candle, it signals the formation of an uptrend.
Arrest bullish 패턴은 양봉+음봉+양봉 캔들 조합이며 음봉이 두 양봉 사이에 갇히며 '체포'당하는 구조다. 두번째 양봉 고가가 돌파되는 양봉이 나타나면 상승 추세가 형성된 신호다
제9편. 역습 패턴 Counterattack Pattern
제1장. Push-Down High Bear
<HD한국조선해양 009540 일간 차트>
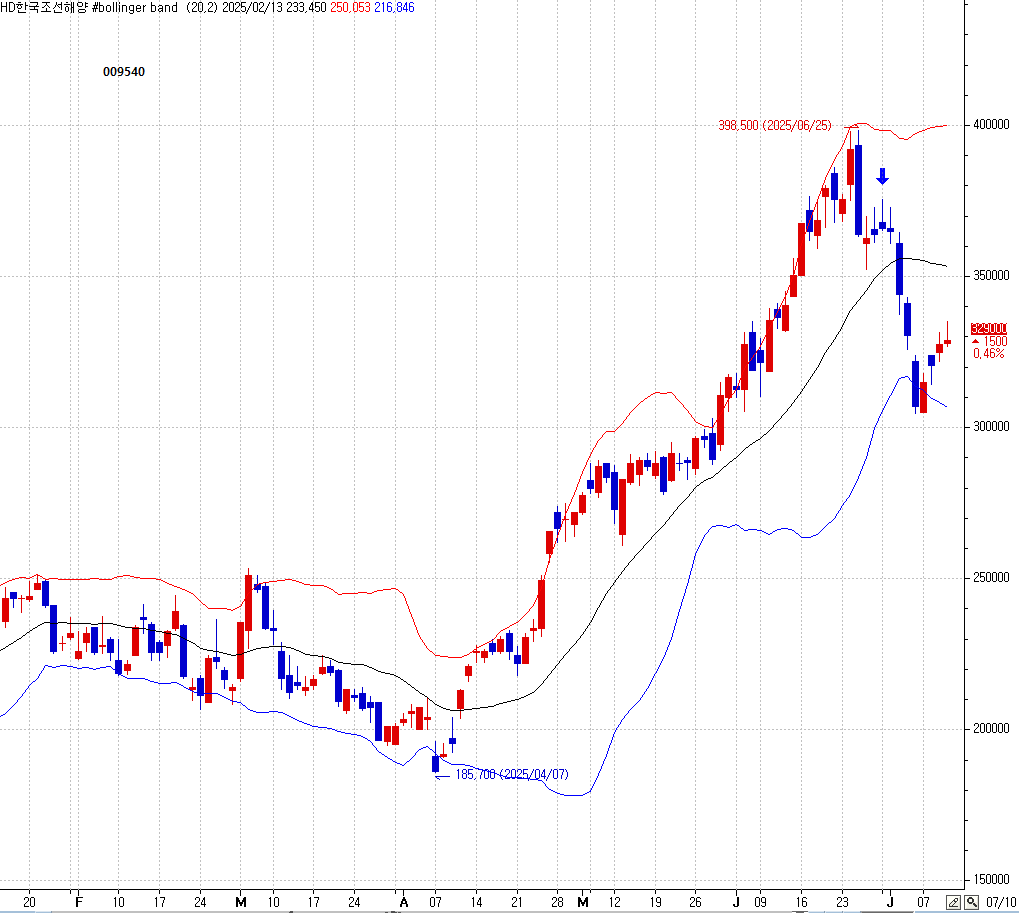
전일 음봉 고가보다 금일 음봉 고가가 더 높은 음봉
두 번째 음봉의 고가가 첫 번째 음봉보다 높다는 것은 매도세가 고점을 위로 한번 더 들어올린 후 강하게 눌러버리는 형국이다. 시세를 ‘올렸다가 더 세게 눌러 찍는’ 구조라는 점에서 아래와 같이 정의할 수 있다:
When the high of the second bearish candle is higher than that of the first, it indicates that the selling pressure lifts the price slightly higher before forcefully pushing it down.
This forms a structure where the price is pushed up and then slammed down harder, and can be defined as follows:
-
형태: 음봉 + 고점 더 높은 음봉 (2연속 음봉, 2번째 고점이 더 높음)
-
특징:
-
두 번째 음봉이 첫 번째 음봉의 고점을 돌파 → 상승 시도
-
그러나 종가는 하락 마감 → 매도세가 상승세를 완전히 눌러버림
-
-
의미:
-
고점에서 매도세가 급격히 유입됨
-
함정 상승 후 매도 압력 강화
-
추세 반전 또는 강한 하락 신호 가능성
-
-
-
영어 표현:
Push-Down High Bear또는Upper Trap Bear
-
Trap Wick Bear: 위 꼬리로 함정 유도 후 하락
-
Fake Break Bear: 전일 고가 돌파 후 실패
-
Hammer Down Bear: 올렸다가 강하게 내려찍는 구조 강조
Definition:
A two-candle bearish pattern where the second bearish candle has a higher high than the first, but still closes lower. This suggests that sellers briefly allowed the price to rise, only to overwhelm it with stronger downward pressure.
Structure:
-
Candle 1: Bearish (lower close), sets an initial high
-
Candle 2: Bearish, but with a higher high than Candle 1
→ Closes even lower, rejecting the breakout attempt
Interpretation:
-
A trap for breakout buyers — price is pushed up before being aggressively pushed down
-
Indicates exhaustion of upward momentum and emergence of dominant selling pressure
-
Potential sign of trend reversal or strong continuation of a downtrend
Alternative Names:
-
Upper Trap Bear
-
Fake Break Bear
-
Hammer Down Bear
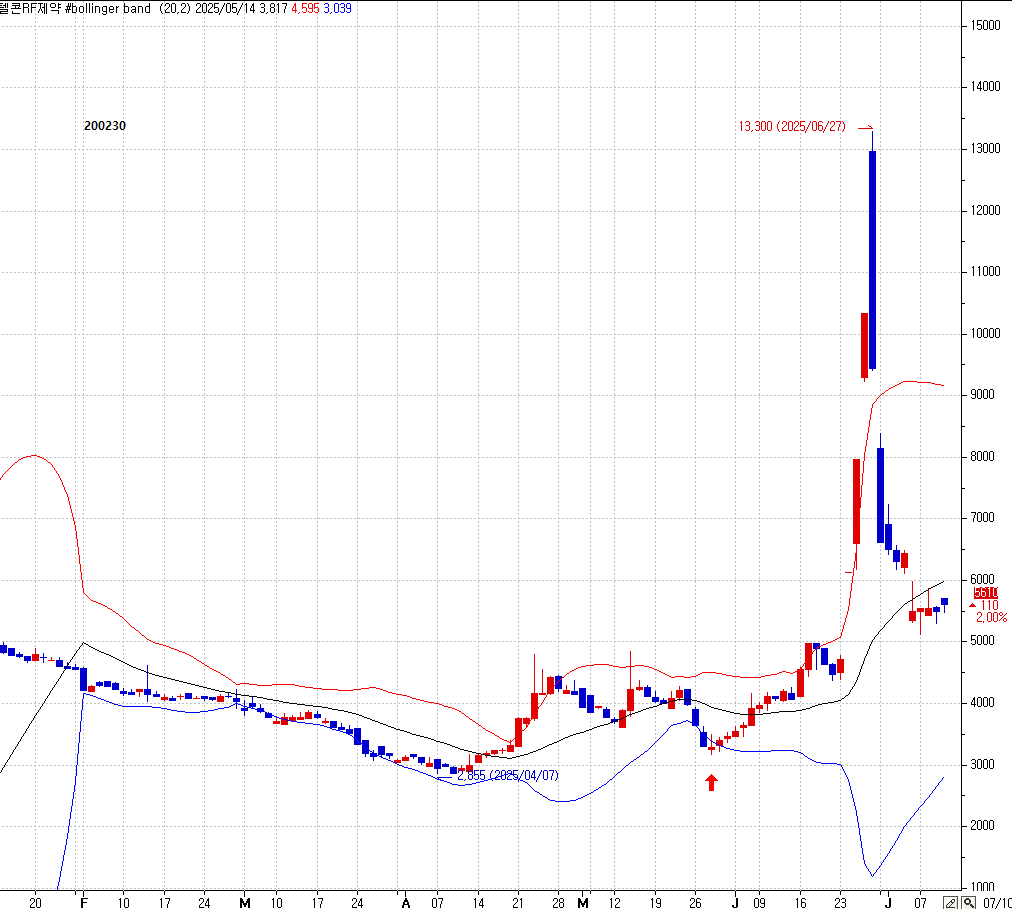
제2장. Lift-Up Low Bull
<한미반도체042700> 일간 차트 2024/12/11
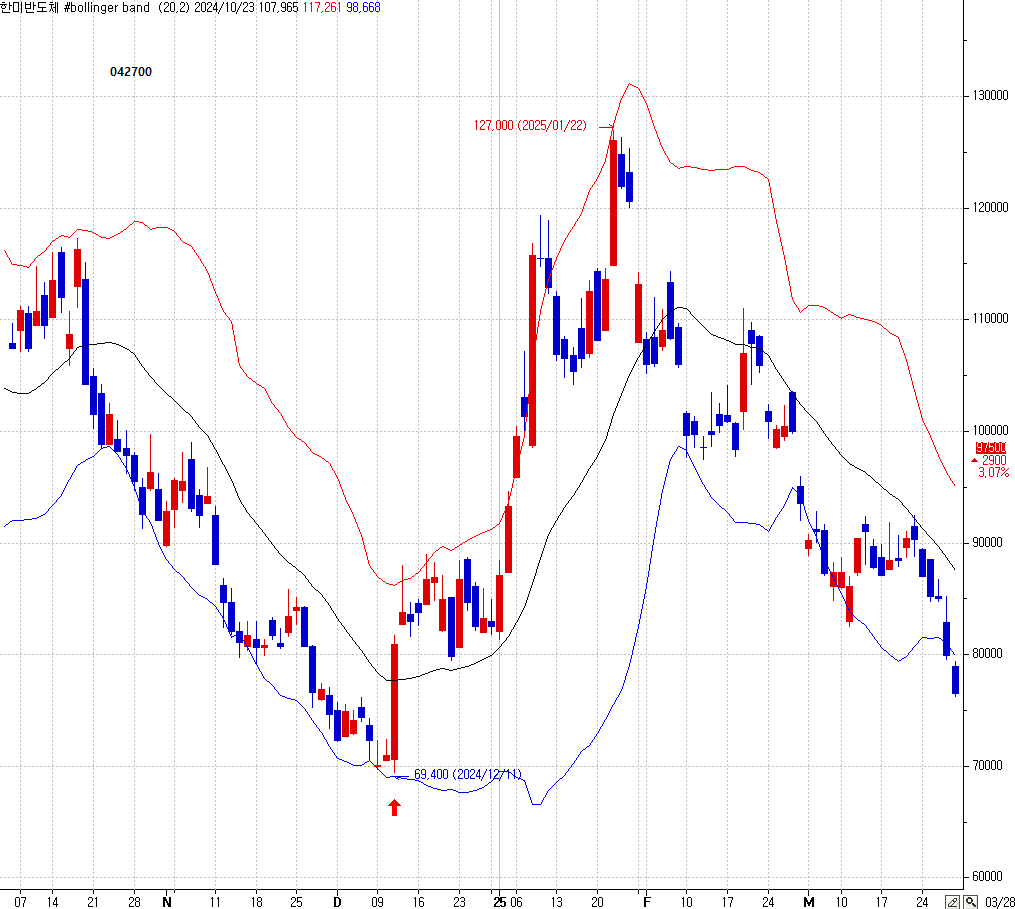
전일 양봉 저가보다 낮은 상태에서 밀어 올린 양봉
<텔콘RF제약200230>

전일 양봉 저가보다 낮은 저가 양봉으로 전일 양봉 고가 돌파
<크라우드웍스355390>
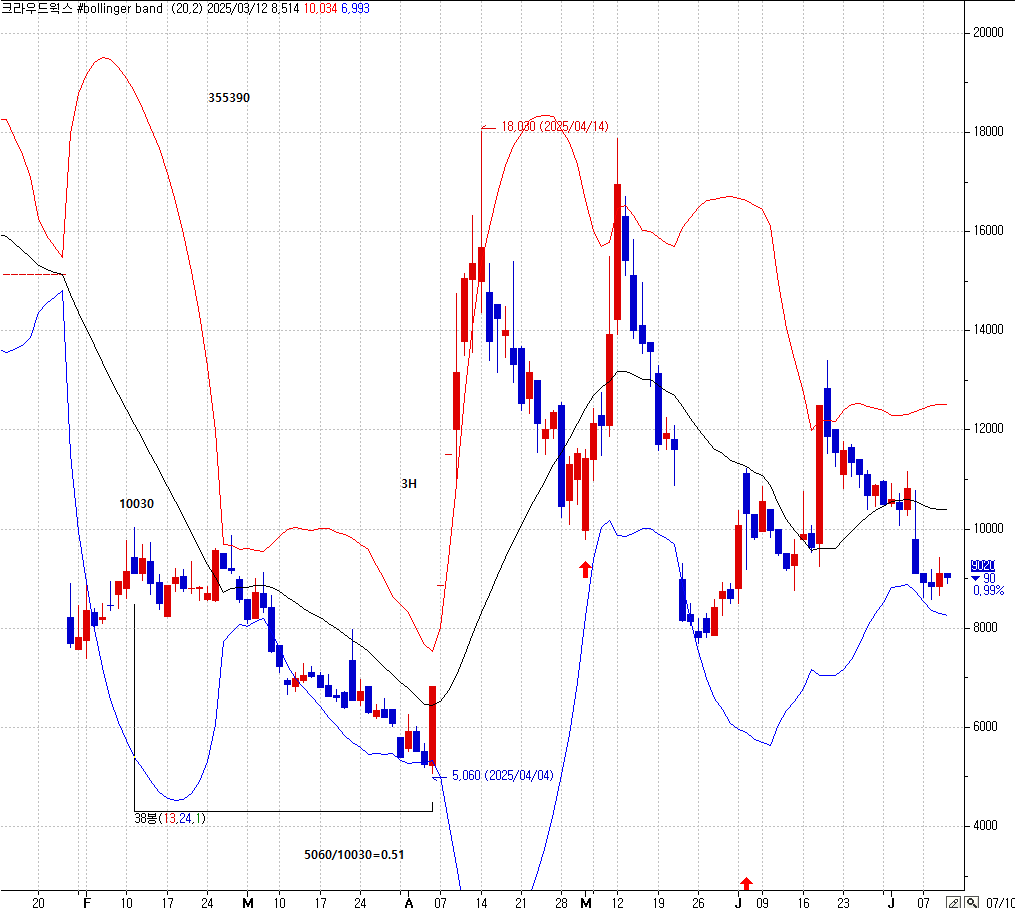
볼린저 하단 밴드 지지
전일 양봉 저가보다 낮은 위치에서 바닥 형성후 종가 양봉
<다날064260 일간 차트>
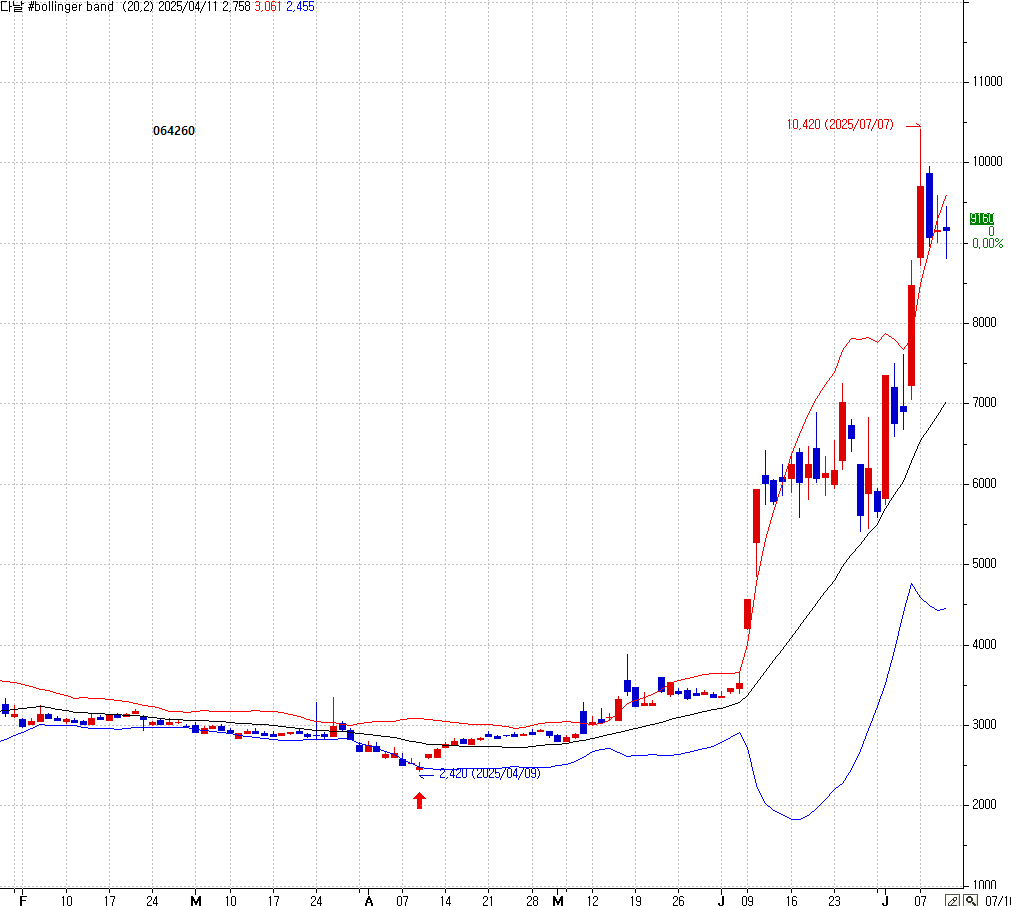
양봉이 두 개 연속되고, 두 번째 양봉의 저가가 첫 번째 양봉의 저가보다 낮다는 건 매수세가 아래를 받쳐주며 위로 퍼올리는 강한 흐름을 의미한다. 아래에서 위로 밀어 올리는 느낌에 어울리는 구조다:
When there are two consecutive bullish candles and the low of the second bullish candle is lower than that of the first, it indicates a strong upward momentum where buyers are supporting the price from below and lifting it upward.
This structure reflects a push-up movement from the bottom, suggesting a sustained and forceful buying trend.
-
형태: 양봉 + 더 낮은 저가의 양봉 (2연속 양봉, 2번째 저가가 더 낮음)
-
특징:
-
조정 없이 상승이 이어지는 구조
-
지지선이 낮아지는 강세 신호
-
두 번째 양봉이 전일 저가를 붕괴하고 상승 마감
-
-
의미:
-
매수세가 아래에서 위로 퍼올리며 상승 중
-
하락 압력을 흡수하고 누적된 매수세로 돌파 시도
-
Definition:
A two-candle bullish pattern where the second bullish candle has a lower low than the first, signaling that buyers are supporting the price at a lower level. This structure indicates growing bullish strength and confidence.
Structure:
-
Candle 1: Bullish (closes higher), establishes an initial low
-
Candle 2: Bullish, with a lower low than Candle 1
→ Closes higher again, continuing the upward move
Interpretation:
-
Shows that pullbacks are becoming shallower, a classic sign of rising demand
-
Indicates upward pressure from below, with buyers "lifting the floor"
-
Often seen as a bullish continuation signal, especially in early trend phases or pre-breakout formations
제10편. 상한가(H) 패턴
제1장. 1H 패턴
<카카오페이377300>
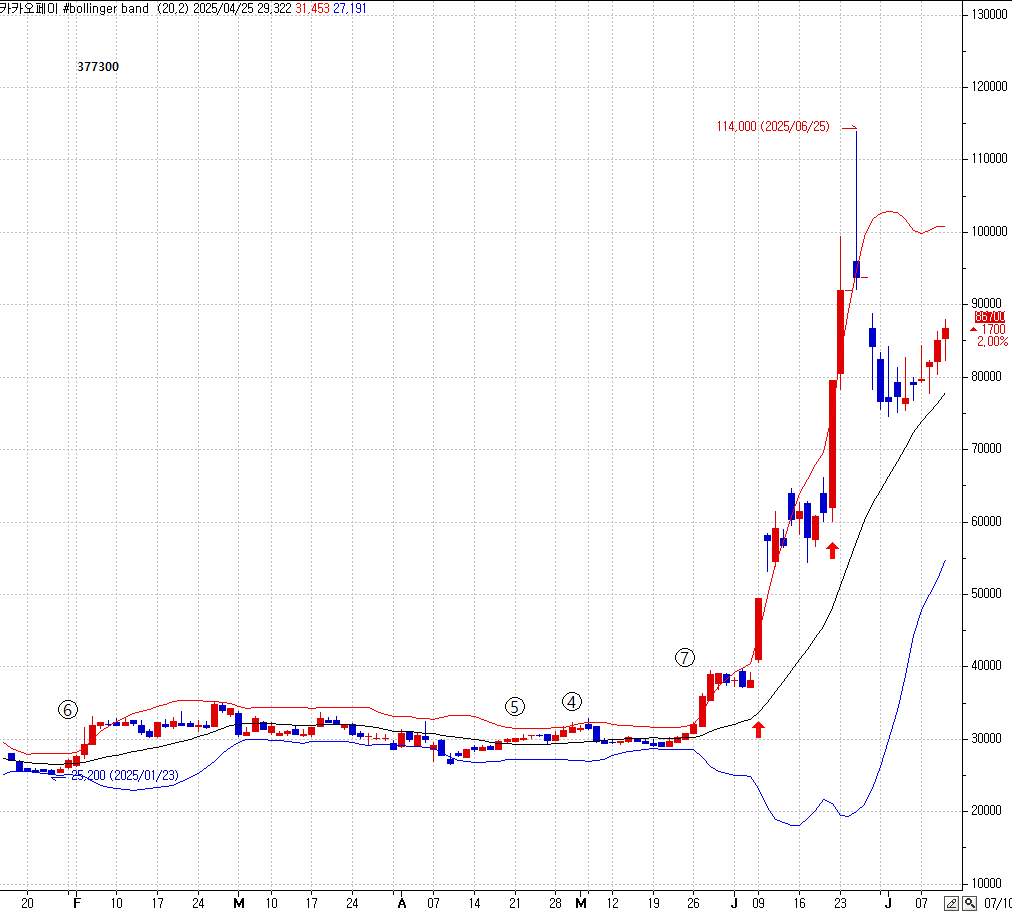
연속4양 이상 상승 패턴......매집 흔적
매집후 상한가 30% 상승....상한가 이후 분할 익절
제2장. 2H 패턴
<다날 064260>
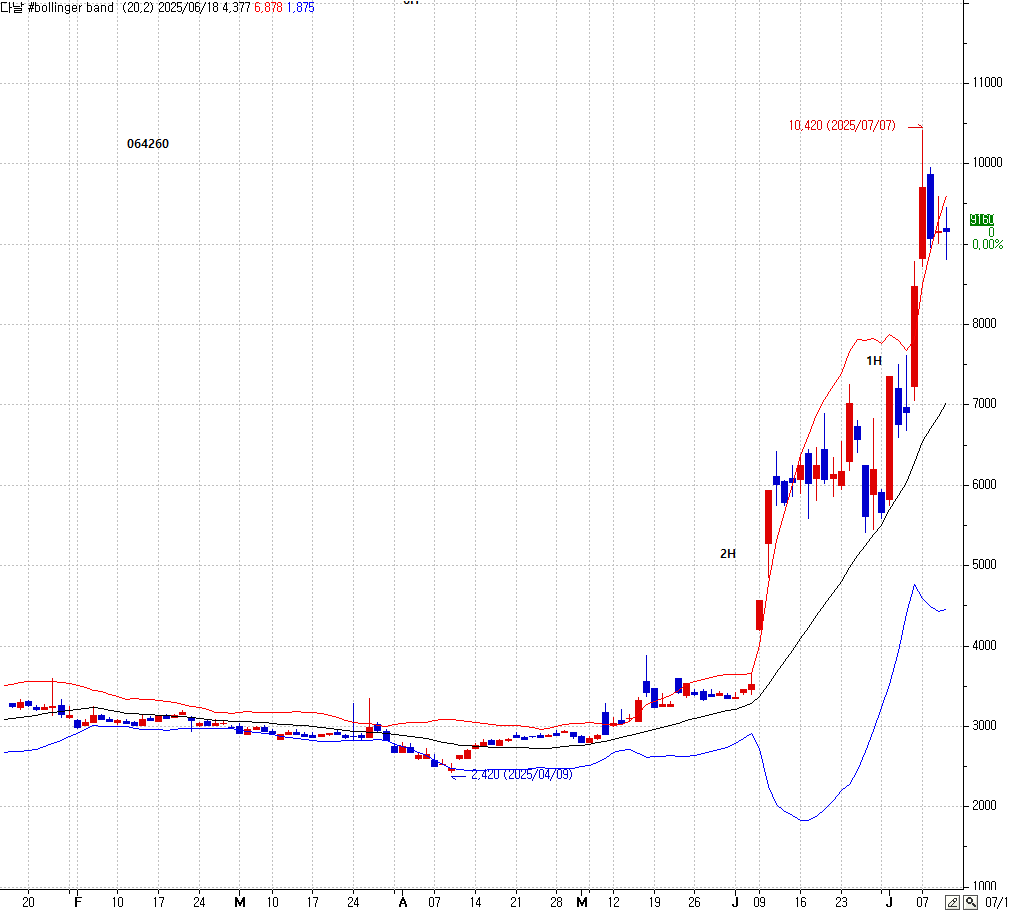
볼린저 미들 밴드 지지로 적삼병
2일 연속 상한가 익일부터 분할 매도..........상향 조정
볼린저 미들 밴드 지지로 새로운 상한가
<상지건설042940>
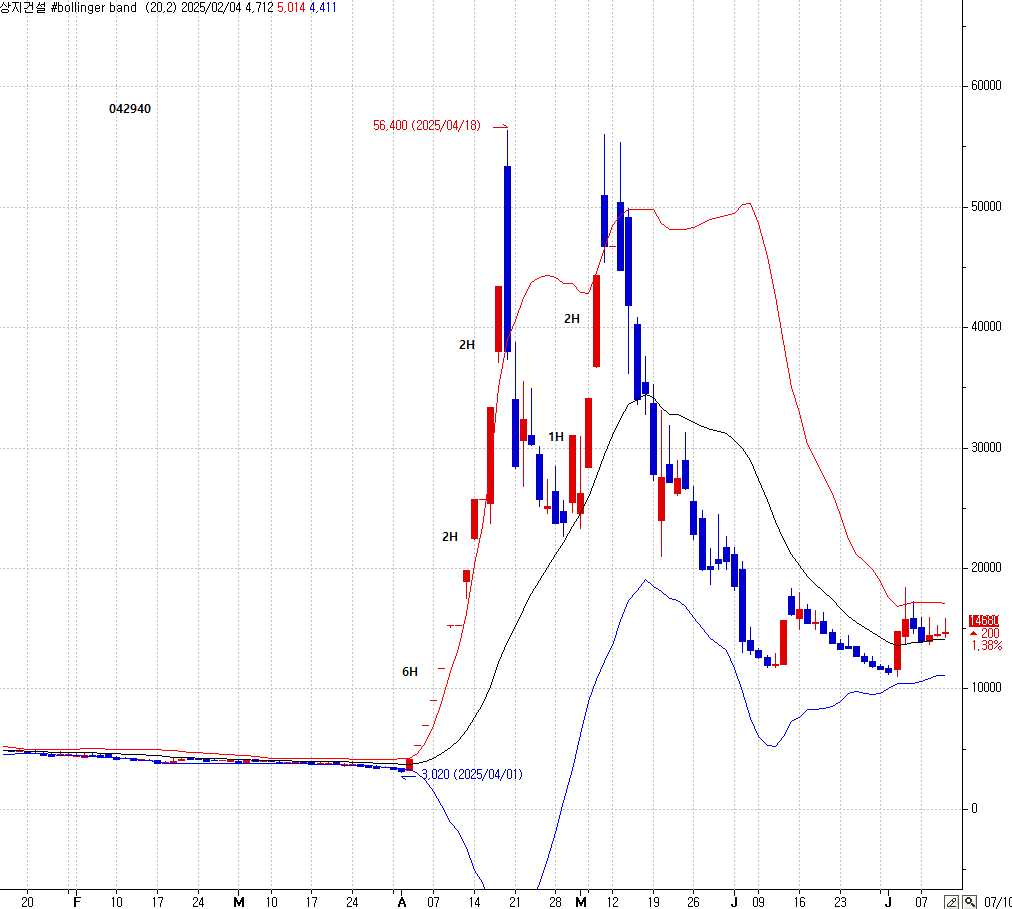
6H+2H+2H......3번의 상승......56400/3020=18배 상승
볼린저 미들 밴드 지지 반등......1H+2H 익일부터 분할 매도......볼린저 상단 밴드 걸친 음봉 연속
제3장. 3H 패턴
<유진로봇056080>
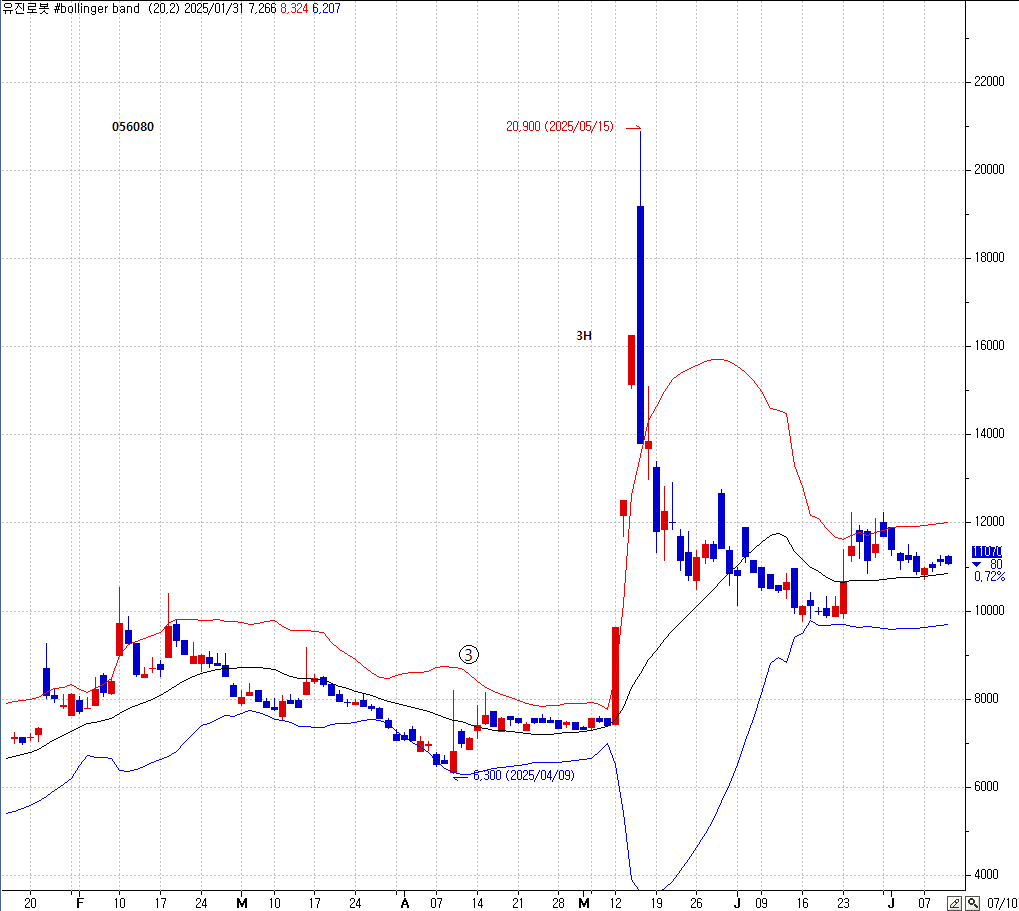
미들 밴드 돌파하는 적삼병
미들 밴드 지지하는 13일~16일 3~번 음봉 흐름 조정
상단 밴드 돌파하는3H
3양 패턴이 3H로 진행
3일 H 익일 천정
<텔콘RF제약200230>
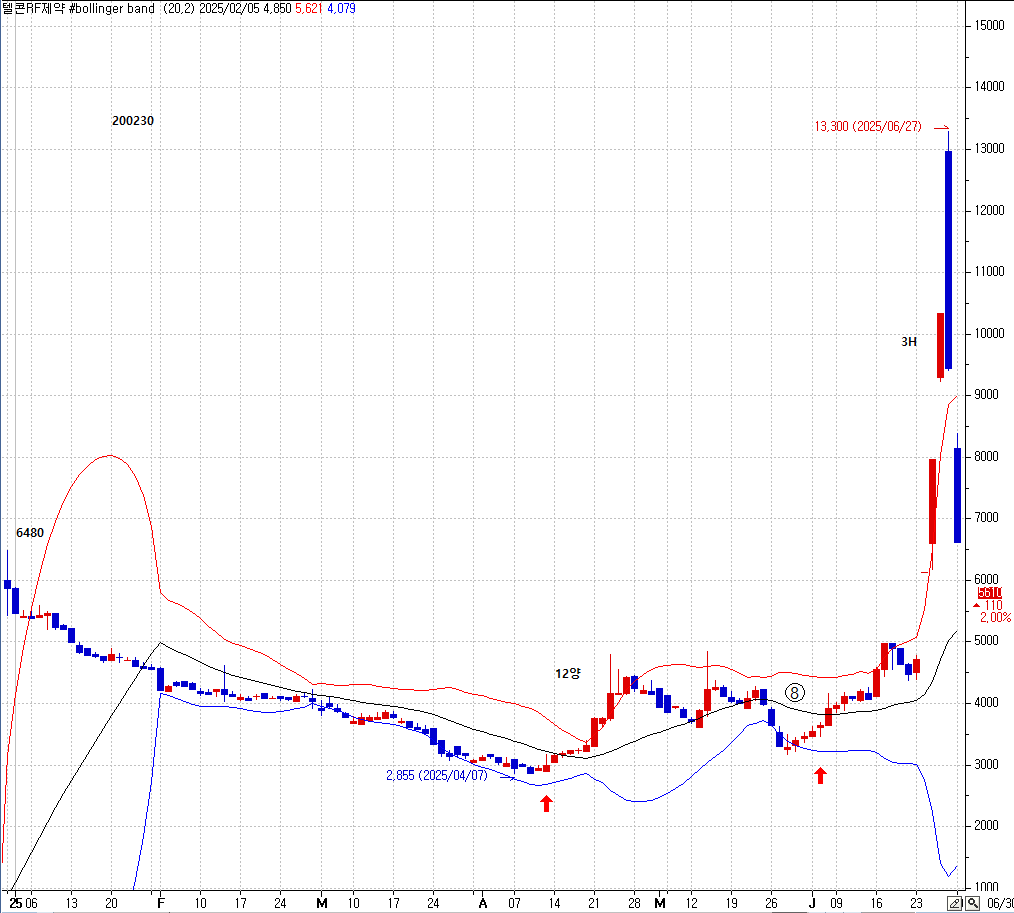
연속12양
연속8양
3H
3일 H 익일 천정
<크라우드웍스355390>

38일간 50% 하락 바닥
3H 이후 4양봉 추가
제4장. 4H 패턴
<에이비온203400>
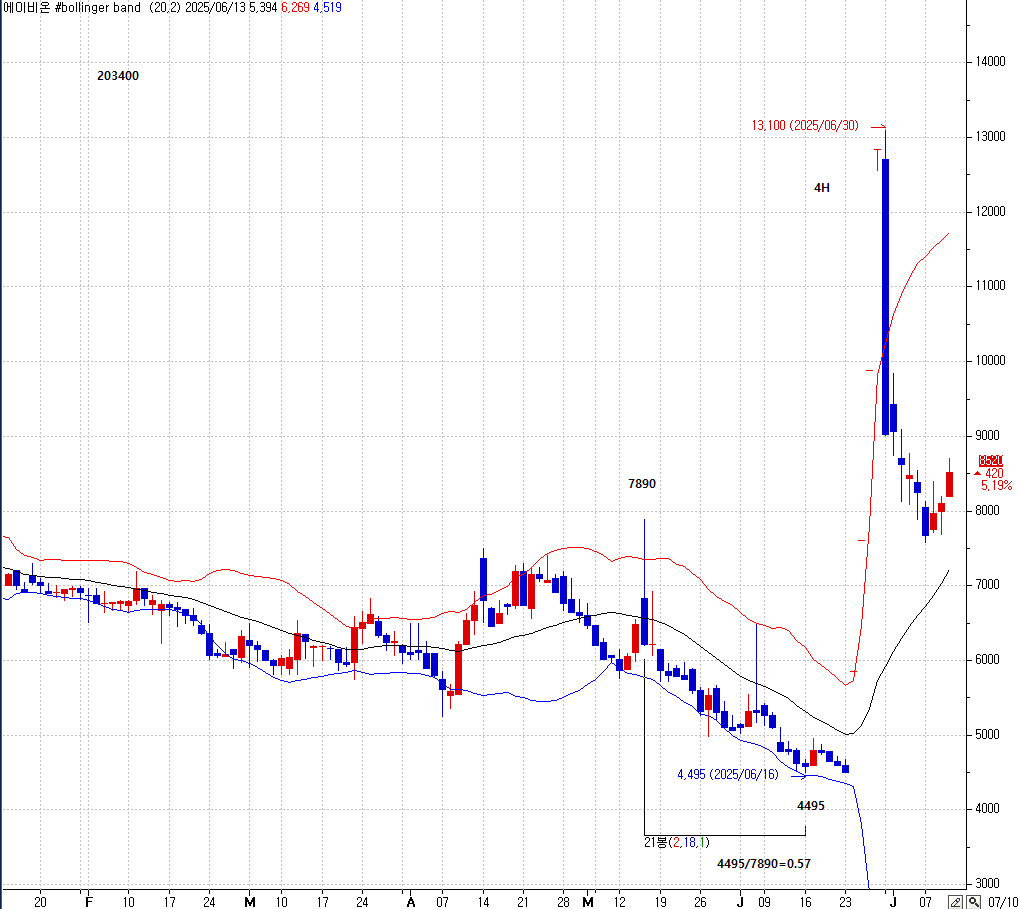
21일간 43% 하락 바닥
4H 익일 시가 하락 출발......고가 천정
제11편. Trap after Breakout
제1장. Bull Trap after Breakout
<텔콘RF제약200230>

전고점 돌파 천정
"A sharp drop occurs at the second rally peak, which breaks above the previous high. The downside target is a symmetrical move equal to the preceding rally."
"직전 고점을 돌파한 두 번째 반등의 천정에서 급락이 발생한다. 하락 목표치는 이전 반등폭과 동일한 대칭적인 하락이다."
-
"Bull Trap after Breakout"
-
직전 고점을 살짝 넘긴 뒤 강하게 하락하는 패턴
-
예: “The price formed a bull trap after breaking above the previous high.”
-
-
"False Breakout and Reversal Drop"
-
위로 돌파 후 반전 하락이 일어나는 구조를 설명
-
예: “The second rally created a false breakout before a sharp reversal.”
-
-
"Double Top Break and Flush"
-
쌍봉처럼 보이되 돌파 후 매도세 유입으로 폭락
-
예: “A double top break and flush trapped late buyers at the highs.”
-
-
"Breakout Failure Pattern"
-
돌파 실패 패턴이라는 점을 중립적으로 표현
-
예: “The breakout failure at the previous high triggered a steep decline.”
-
제2장. Bear Trap after Breakout
<텔콘RF제약200230>
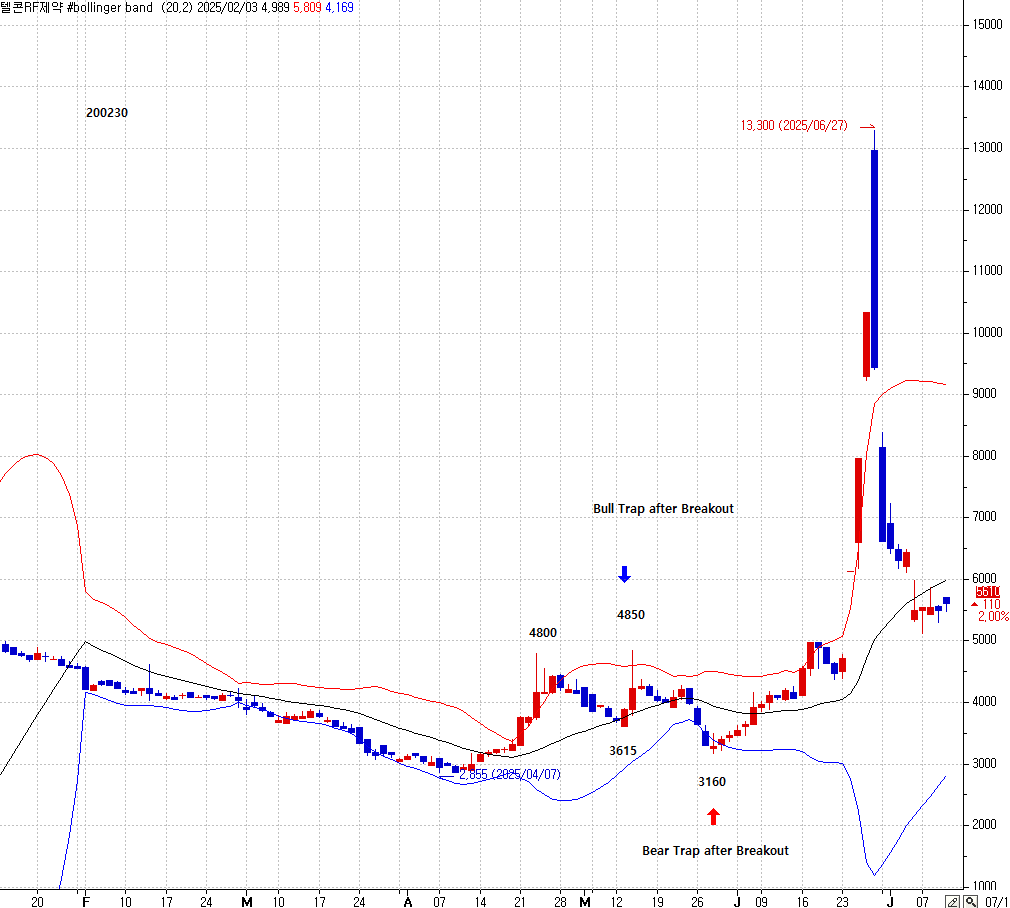
전저점 붕괴 바닧
"A sharp rally occurs at the second dip low, which breaks below the previous bottom. The upside target is a symmetrical move equal to the preceding dip."
직전 바닥을 붕괴하는 두 번째 반락 바닥에서 급등이 나타난다. 상승 목표치는 반락폭의 대칭 상승이다
1. "Bear Trap after Breakdown"
-
설명: 직전 저점을 하향 돌파한 뒤 급반등하는 구조
-
예문:
“The price formed a bear trap after breaking below the previous low.”
2. "False Breakdown and Reversal Rally"
-
설명: 지지를 이탈한 것처럼 보였지만 곧바로 강하게 반등
-
예문:
“The second dip created a false breakdown before a sharp upward reversal.”
3. "Double Bottom Break and Rip"
-
설명: 이중바닥처럼 보이다가 저점 이탈 후 강한 매수세 유입
-
예문:
“A double bottom break and rip trapped late sellers at the lows.”
4. "Breakdown Failure Pattern"
-
설명: 하락 돌파 실패 후 반등세로 전환되는 패턴
-
예문:
“The breakdown failure at the previous low triggered a strong rally.”
ㅡㅡㅡㅡㅡㅡㅡㅡㅡㅡㅡㅡㅡㅡㅡㅡㅡㅡㅡㅡㅡㅡㅡㅡㅡㅡㅡㅡㅡㅡㅡㅡㅡㅡㅡㅡㅡㅡㅡㅡㅡㅡㅡㅡㅡㅡㅡㅡ
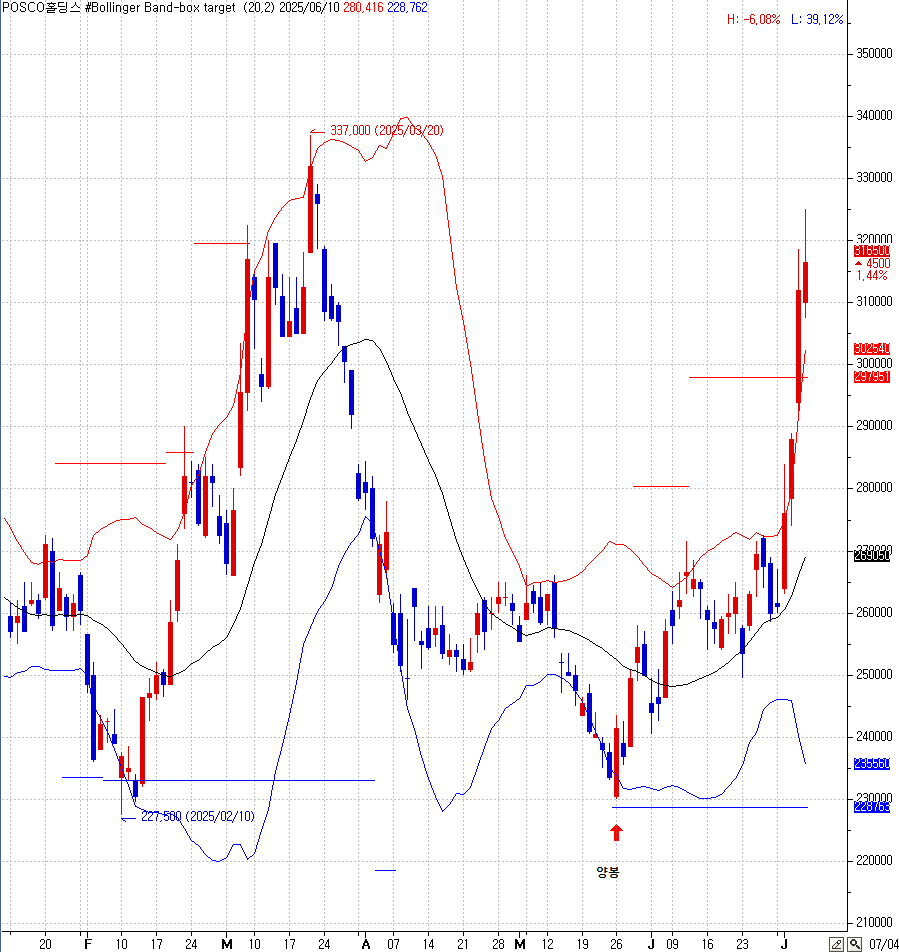
제12편. Two-Day Bull Trap Gap Down
제1장. Frog Hop Gap down
<포스코홀딩스 005490 일간 차트>
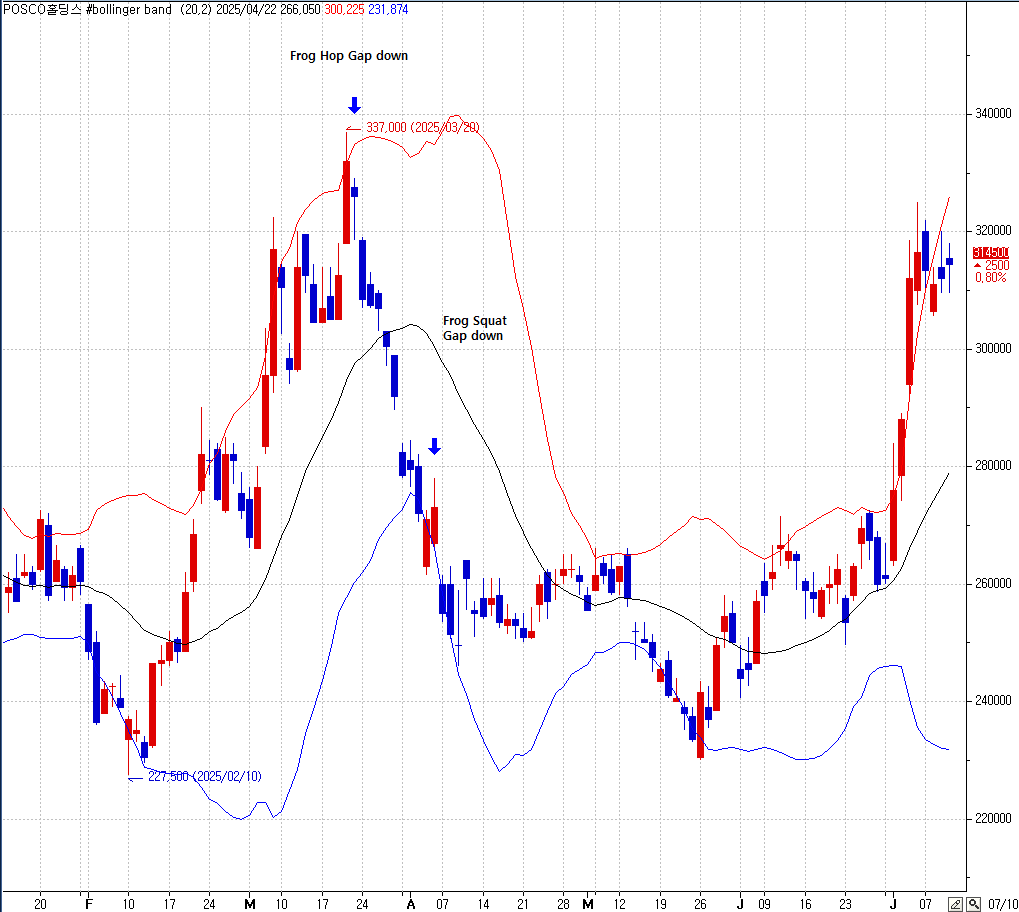
상승이 확대된 연속 2양봉 익일 시가 갭 하락
제2장. Frog Squat Gap down
<포스코홀딩스 005490 일간 차트>

상승이 축소된 연속 2양봉 익일 시가 갭 하락
제13편. Deceptive candles
제1장. Blue candle with a higher close
<캐리313760 일간 차트>
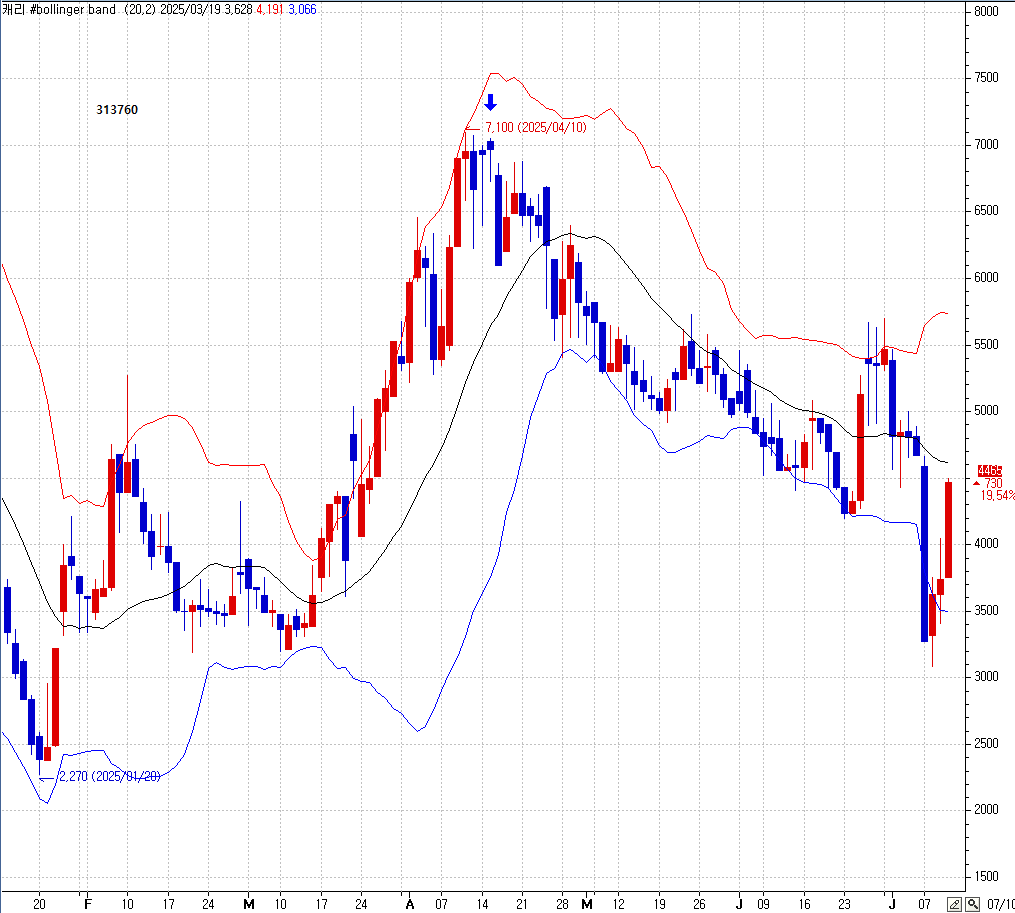
가격이 상승한 음봉
Bearish candle with price gain
Bearish-looking but bullish candle
Negative candle with upward movement
A bearish-looking candle with a bullish outcome
-
Bearish candle with price gain
👉 가격이 상승한 음봉 -
Bearish-looking but bullish candle
👉 겉보기엔 음봉이지만 실제로는 강세인 캔들 -
Negative candle with upward movement
👉 하락형 캔들이지만 상승 흐름을 동반한 캔들 -
A bearish-looking candle with a bullish outcome
👉 약세처럼 보이지만 결과적으로는 상승한 캔들
제2장. Red candle with a lower close
<텔콘RF제약200230> 일간 차트
가격이 하락한 양봉
익일 가격이 상승한 양봉 추가...연속 8일 양봉
Bullish candle with a price loss
Positive candle with a lower close than the previous day
Bullish body with bearish context
Upward body, downward story
-
Bullish candle with a price loss
👉 가격이 하락한 양봉 -
Positive candle with a lower close than the previous day
👉 전일보다 낮게 마감한 양봉 캔들 -
Bullish body with bearish context
👉 양봉이지만 전체 흐름은 약세인 캔들 -
Upward body, downward story
👉 몸통은 상승인데 흐름은 하락인 스토리
→ 또는 의역해서: 올랐지만 하락을 말해주는 캔들
제14편. Non-breakout candle
제1장. Non-breakout red candle
<대한항공>일간 차트
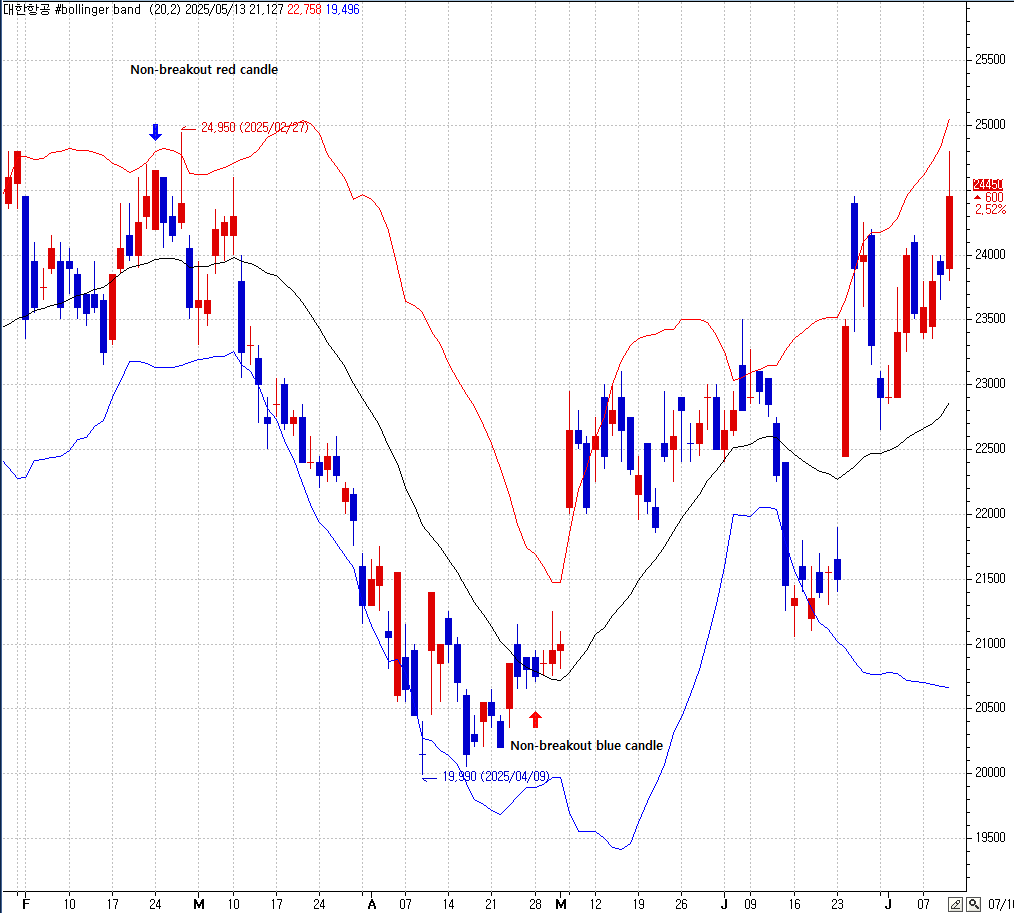
Inside-day bullish candle
전일 종가보다 상승한 양봉이지만 전일 고가를 돌파하지 않은 양봉은 상승 의지를 보였지만 뚜렷한 강세 신호는 아닌, 제한된 상승으로 해석됩니다.
제2장. Non-breakout blue candle
<대한항공>일간 차트

Inside-day bearish candle
전일 종가보다 하락한 음봉이지만 전일 저가를 붕괴시키지 않은 음봉은 약세처럼 보이지만 실질적인 하락은 제한적인 상태를 나타냅니다.
제15편. Bluff and Reversal Candle
제1장. Bluff-Up Reversal candle
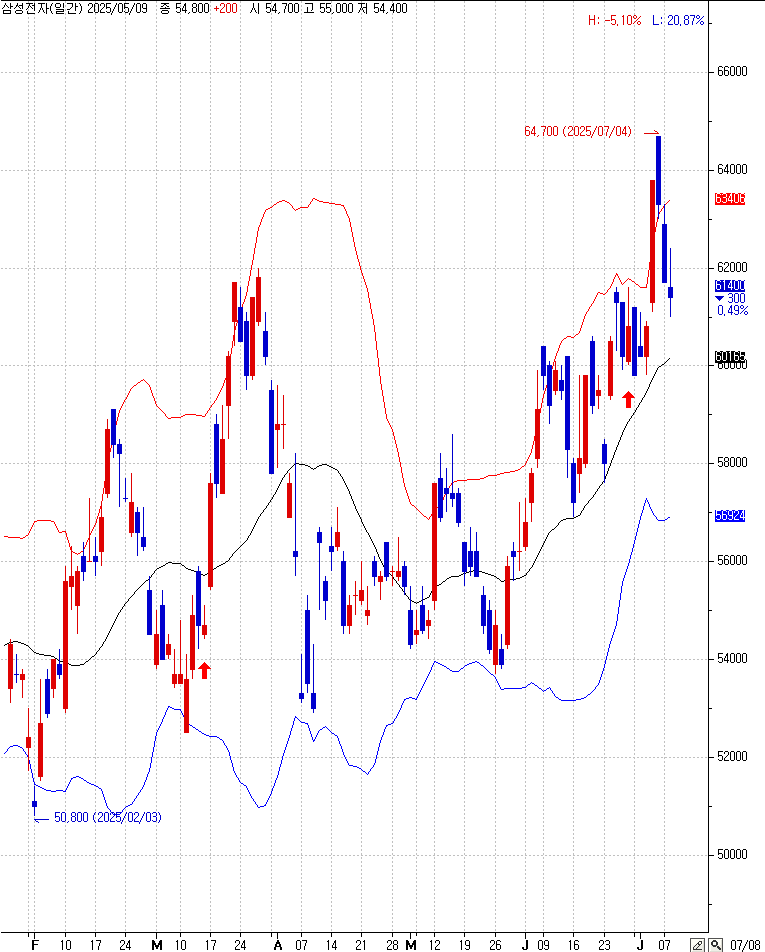
<삼성전자 일간 차트>

전일 양봉 익일 시가 상승 출발
전일 양봉 고가와 전일 양봉 종가 사이 공간에 금일 시가 형성
전일 종가 매수세 익절로 종가 하락 음봉 형성
<다날 064260> 일간 차트
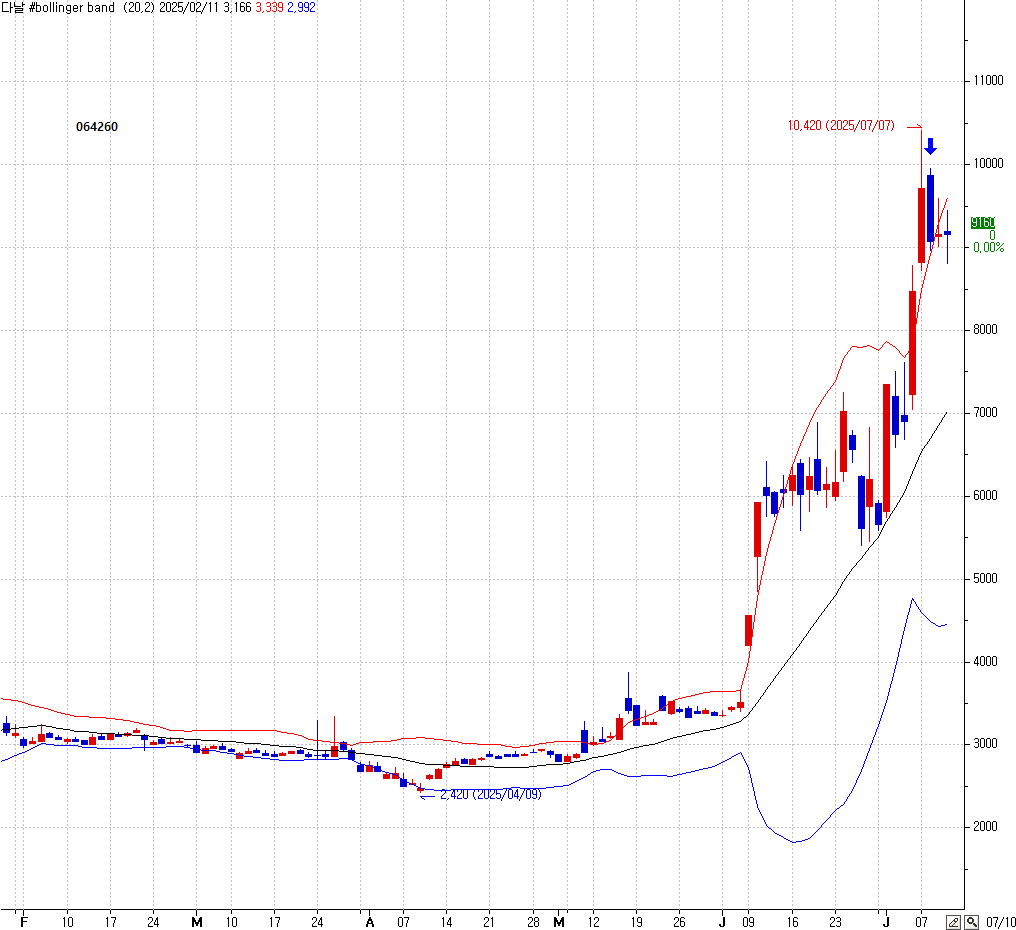
Bluff-Up Reversal candle 이란 전일 양봉일때 금일 시가가 전일 종가 보다 높고 전일 고가보다 낮은 구간에서 출발해서 전일 종가 이하로 하락한 음봉을 말한다
A Bluff-Up Reversal candle refers to a bearish candle that appears after a bullish day, where the current day opens above the previous close but below the previous high, then declines to close below the previous close.
제2장, Bluff-Down Reversal candle
<삼성전자 일간 차트>
A Bluff-Down Reversal candle refers to a bullish candle that appears after a bearish day, where the current day opens below the previous close but above the previous low, then rallies to close above the previous close.
Bluff-Down Reversal candle은 전일 음봉 이후 나타나는 양봉으로, 당일 시가가 전일 종가보다 낮지만 전일 저가보다는 높은 구간에서 시작한 뒤, 반등하여 전일 종가보다 높은 가격에서 마감하는 패턴을 말한다.
<텔콘RF제약 200230> 일간 차트
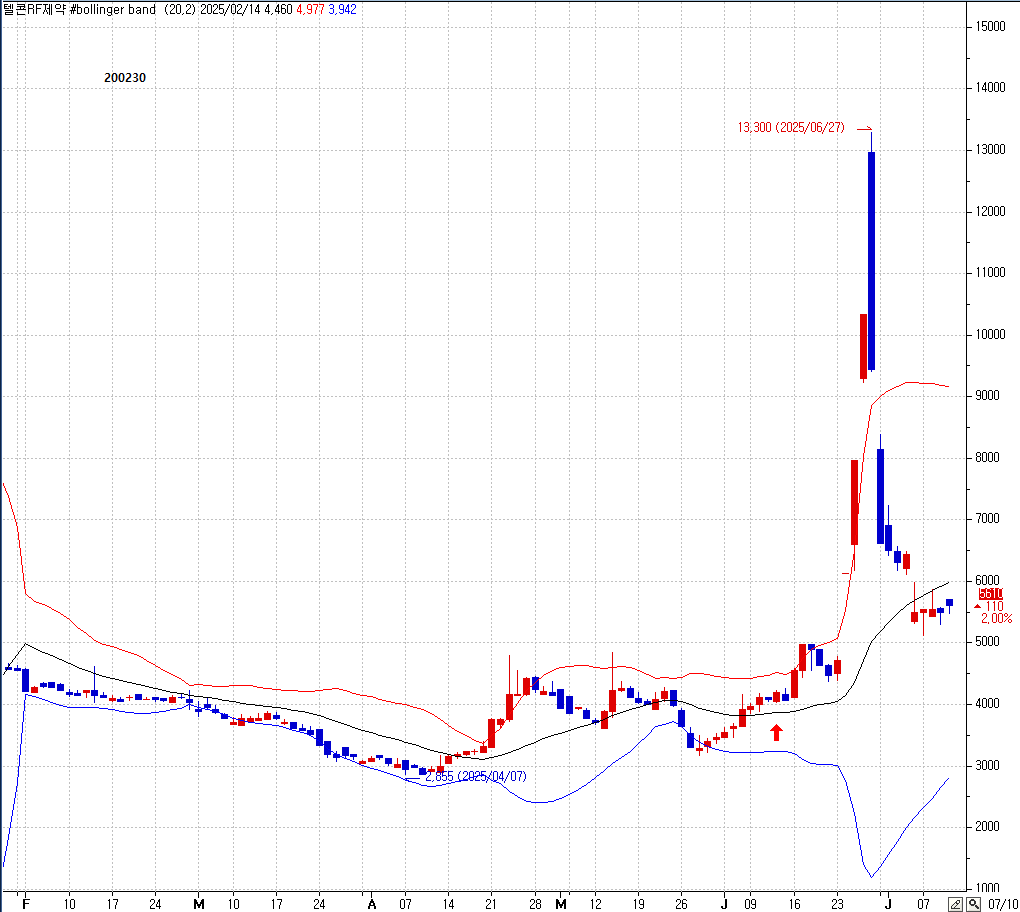
Bluff-Down Reversal candle은 전일 음봉 이후 나타나는 양봉으로, 당일 시가가 전일 종가보다 낮지만 전일 저가보다는 높은 구간에서 시작한 뒤, 반등하여 전일 종가보다 높은 가격에서 마감하는 패턴을 말한다.


